Market Overview
The dollar has come under considerable pressure over the past week or so, leading to some strong moves across major markets. As ever, it has been shifting positioning over the US/China trade dispute. Positive noises towards finally signing of “phase one” have been growing. On New Year’s Eve, President Trump tweeted that a meeting on 15th January to sign an agreement has been pencilled into the diary. Flow out of the safer haven assets (USD, JPY, government bonds) and towards the higher yielding plays (AUD, NZD, CAD) have all been seen. Even EUR and GBP have benefitted, whilst the USD weakness has played into a gold rally. China has also added to this, with an injection of liquidity as the PBOC has cut the reserve requirement ratio by -50bps. The improvement in risk appetite leaves USD under pressure. However, a portion of this move will be borne out of the low volume/low liquidity trading of the Christmas holiday period. So, there is a risk of a degree of retracement on these moves which could set in. There is a hint of this in early moves today. A slight miss on the China Caixin Manufacturing PMI leaves a cautious mood into the European session. Quite how far this goes could depend on how the PMI data plays out in the coming days. We get a look at European data this morning.
Wall Street closed the year on a positive note on 31st December, with the S&P 500 +0.3% at 3230, whilst US futures are +0.3% higher again today. This has helped Asian markets positive this morning with the Shanghai Composite +1.1% (Nikkei closed for public holiday). European futures are taking more of a mixed outlook early today though, with the DAX futures mildly lower by -0.1% whilst FTSE futures are +0.2%. In forex, after days of losses there is a USD recovery hinting today, with gains across the board (aside from CAD which is holding up well). GBP and AUD are the main underperformers. In commodities there is still a bid for gold and silver, whilst oil is also holding up well.
The first proper trading day of the month is a day for manufacturing PMIs on the economic calendar. The Eurozone final Manufacturing PMI for December is at 0900GMT and is expected to be unrevised from the flash at 45.9 (which would be down from the 46.9 in November). The UK final Manufacturing PMI is at 0930GMT and is expected to see a very slight upward revision from the flash to 47.6 (flash December 47.4, final November 48.9). The US Weekly Jobless Claims is at 1330GMT and is expected to tick slightly higher to 225,000 (from 222,000 last week).
Chart of the Day – USD/CAD
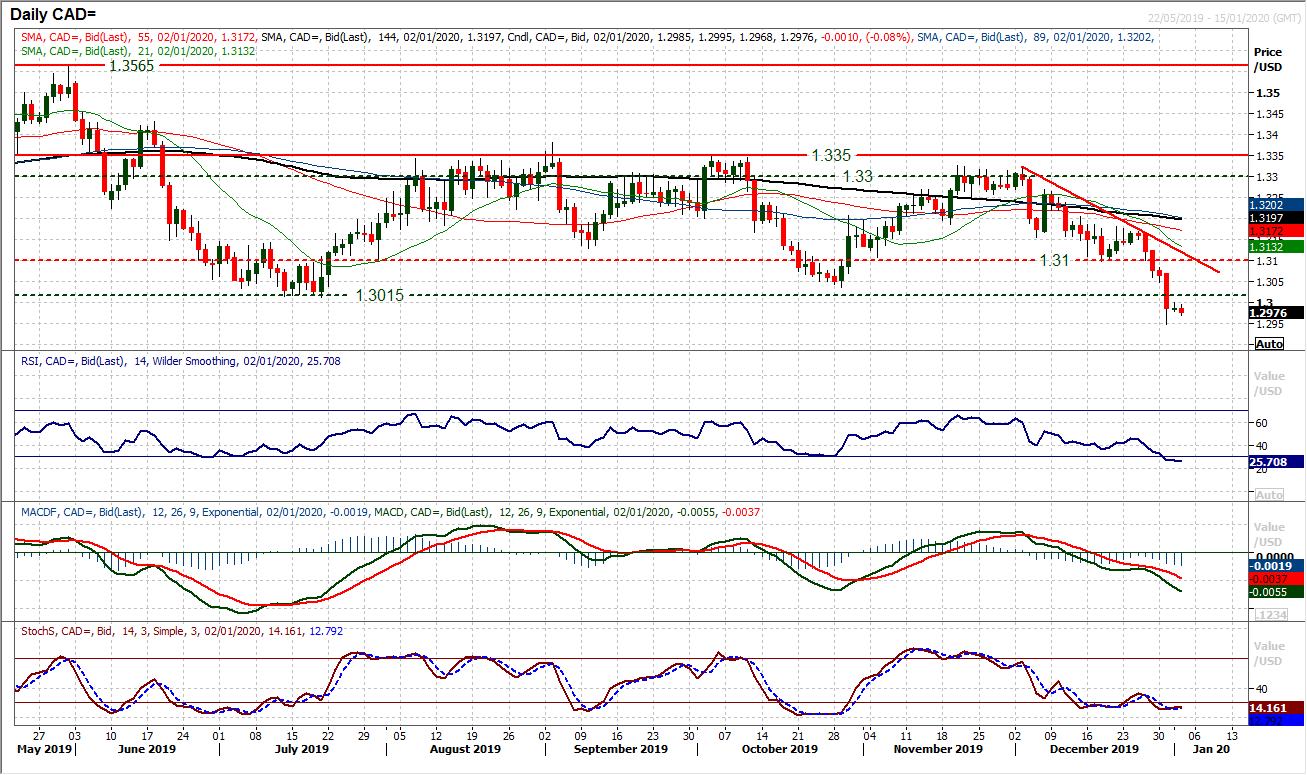
In the run up to Christmas, we had been talking about the strengthening of the Canadian dollar (helped by a rising oil price). However, coming at the same time as a weaker US dollar, meant that USD/CAD completed our downside target of testing the key supports of 1.3015/1.3035 but also broke sharply below 1.3000. This move has opened 1.2780 which is the next key support. We have seen USD/CAD previously break below key support in June only to then retrace on stretched momentum. The latest move brings the RSI under 30 again (the point around where rallies kicked in back in June and October. It leaves a big caveat in chasing the downside break. With the low liquidity of the Christmas trading period, there is a risk of an initial US dollar retracement rally which would pull USD/CAD higher again. It would give a better opportunity to sell (with more downside potential). There is effectively a resistance band of overhead supply 1.3015/1.3035 with further resistance around 1.3100. Support of the sell-off comes around 1.2950 and a close below would continue the track lower.
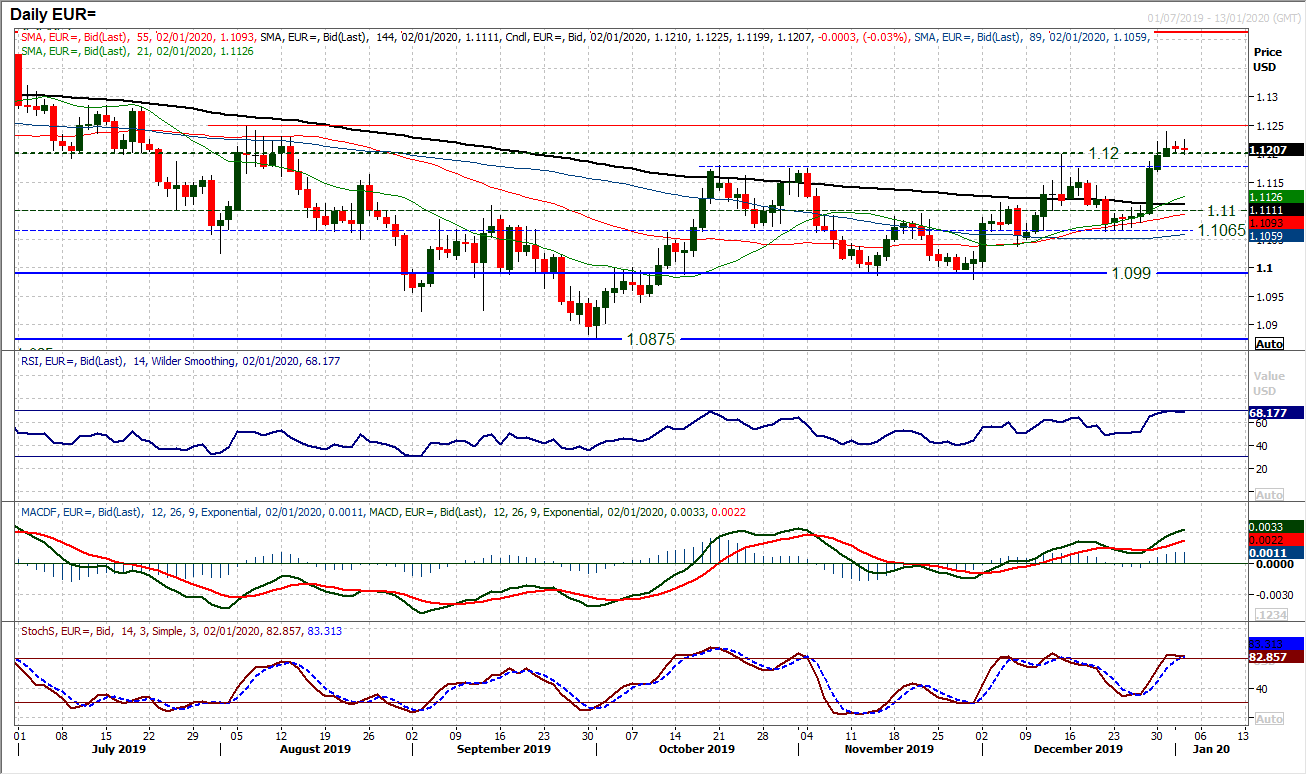
A late December dollar sell-off has pulled EUR/USD sharply higher through $1.1200. However, trading this pair over recent months builds a certain degree of caution over apparent breakouts. Trending moves never seem to be straight forward. The Christmas trading season is beset by low liquidity and it is interesting to see the candlesticks markedly becoming increasingly less positive before today’s initial negative move. A close lower back under $1.1200 would be a warning of a retracement. If this comes today, then it would be a bearish outside day. This comes as the RSI recently hit (and potentially is turning back from) 70, with EUR/USD RSI failing at 70 throughout the past couple of years. The hourly chart shows a notable slowing of positive momentum and even a bearish divergence on RSI and MACD. Under $1.1200 the support is $1.1170 under which the retracement gathers pace back for $1.1100. Initial resistance $1.1225/$1.1240 and then the August 2019 high of $1.1250.
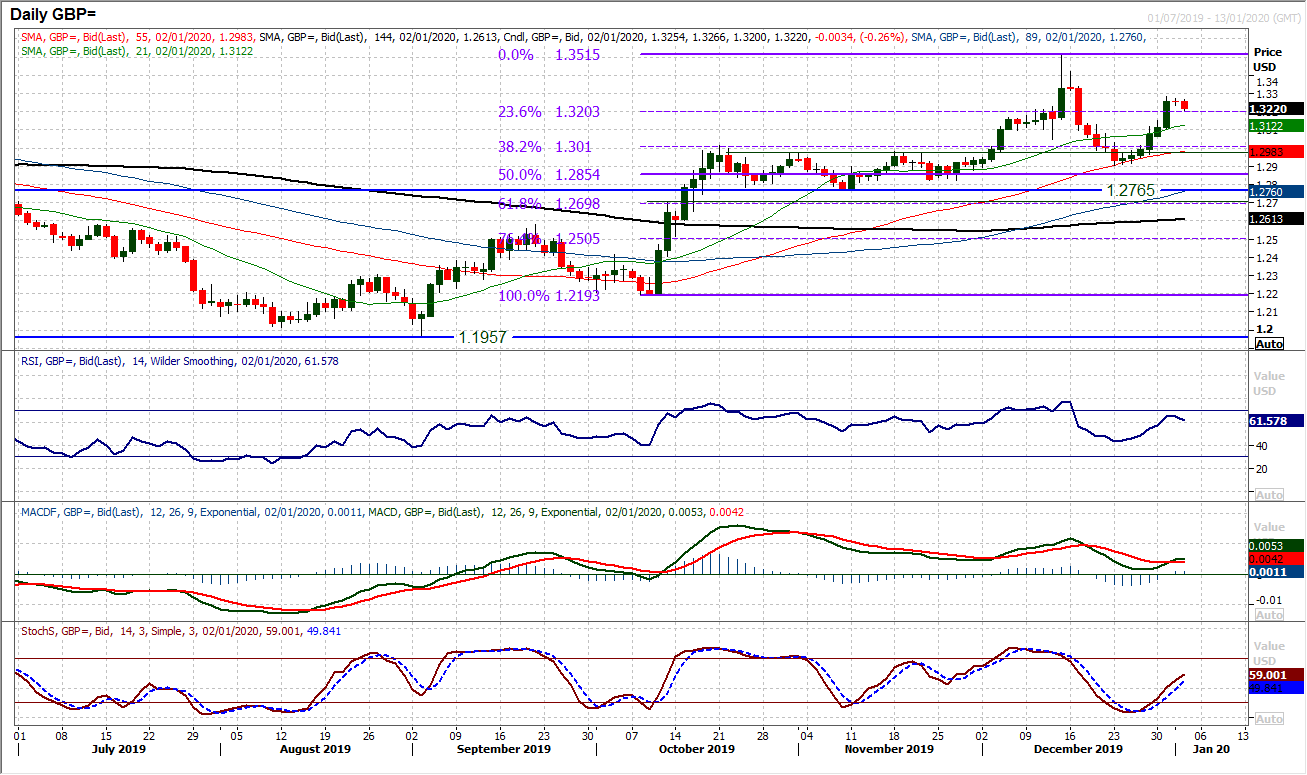
Cable has been an intriguing chart over recent weeks. The UK political climate has been a key driver and will remain so, but there has been a real swing back and forth over late December. The latest run higher came amidst the dollar weakness over Christmas, but this is again threatening to reverse back again today. A run up of around +280 pips on Cable over Christmas from $1.2900 (now key) support is just starting to slide back. This is weighing on Stochastics and MACD lines and is leaving resistance at $1.3283. Watch the hourly RSI moving below 30 and MACD lines moving below neutral. A retreat back into $1.3100/$1.3150 support could be seen initially. We retain our overall positive outlook on Cable above $1.3000 but once more a pull lower could set in now.
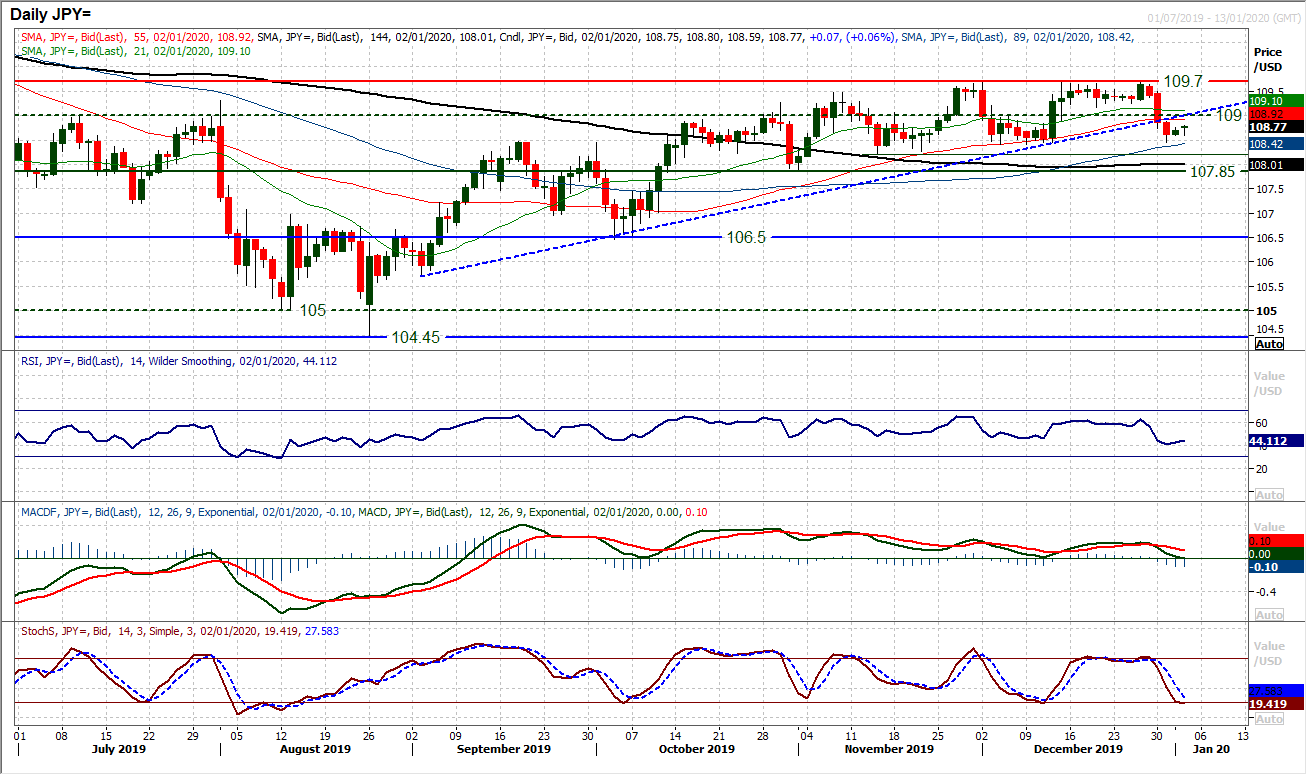
Throughout much of December the dollar bulls struggled to overcome the resistance around 109.70 and in the final throws of 2019 a sharp pullback set in. The sliding dollar has now meant USD/JPY breaking the multi-month uptrend once again. This brings the key support at 108.40 back into play. A breach would be the first key higher low broken for several months and would signal the end of the medium to longer term dollar bull bias. The momentum signals are deteriorating, but the RSI below 45 is a multi-month low and the Stochastics have downside potential. A closing breach of 108.40 would be a key negative move and signal a decisive shift in sentiment. It would open 108.25 and 107.85 supports to be tested. How the market now responds around 109.00 will also be key as this is around the underside of the old four month uptrend but also an old pivot level and is resistance.
Gold
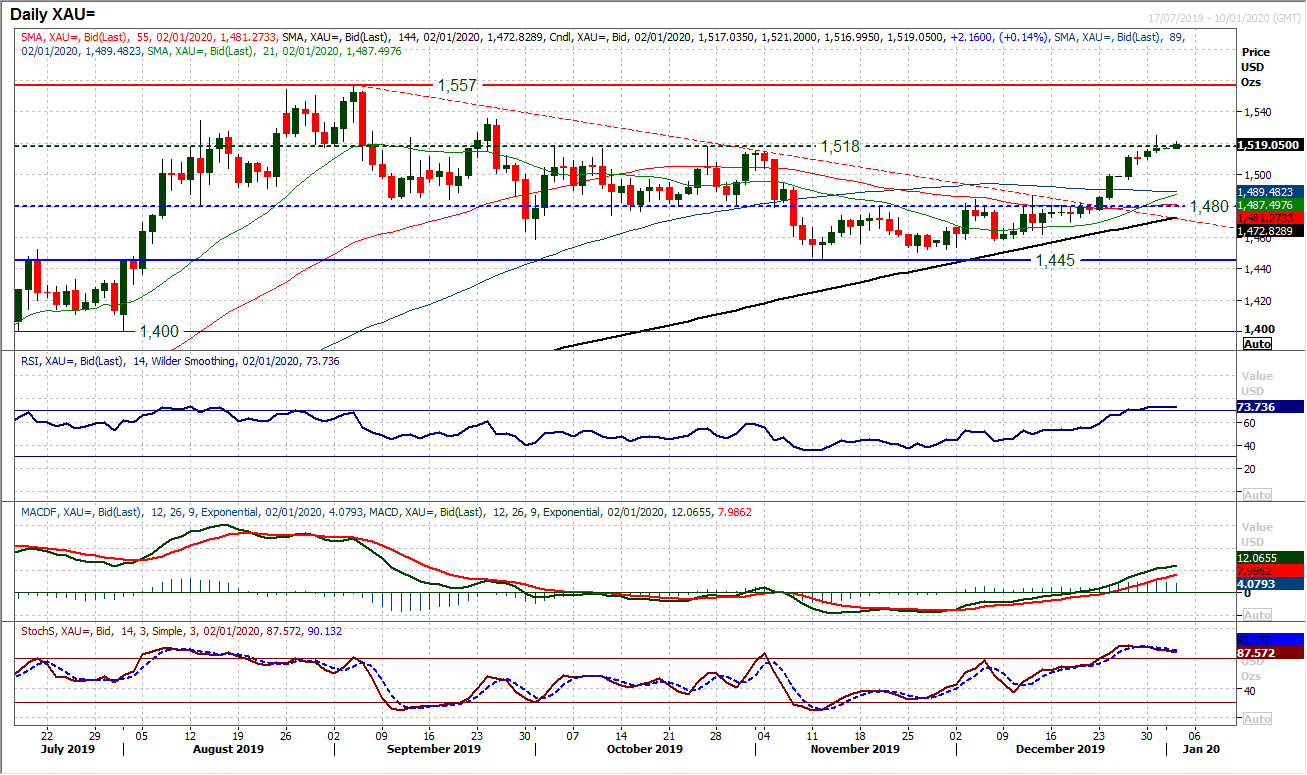
The Gold rally that was seen in the wake of the decisive breakout above $1480 has met the implied target of $1515 and through the key resistance at $1518. This confirms that there has been a decisive shift in the medium to longer term outlook. Instead of moving lower highs and lower lows over recent months, the rally has broken this sequence. It now means that building off $1445 with higher lows and higher highs, the market looks to have swung positive. In the least, it is a big medium term range $1445/$1557, but depending upon how the near term outlook develops, it could be a renewed bull phase. On the next correction, building support above $1480 would be a strong bull signal. There has been a run over (low liquidity trading) Christmas with RSI into the 70s. Momentum is strong but stretched and an initial pullback early in 2020 could be seen. Support is around $1480/$1500. The bulls will look for building on the breakout to test $1536 which is the next key resistance. Initial reaction today remains positive (amidst a broad USD rebound today) which suggests bull strength holding.
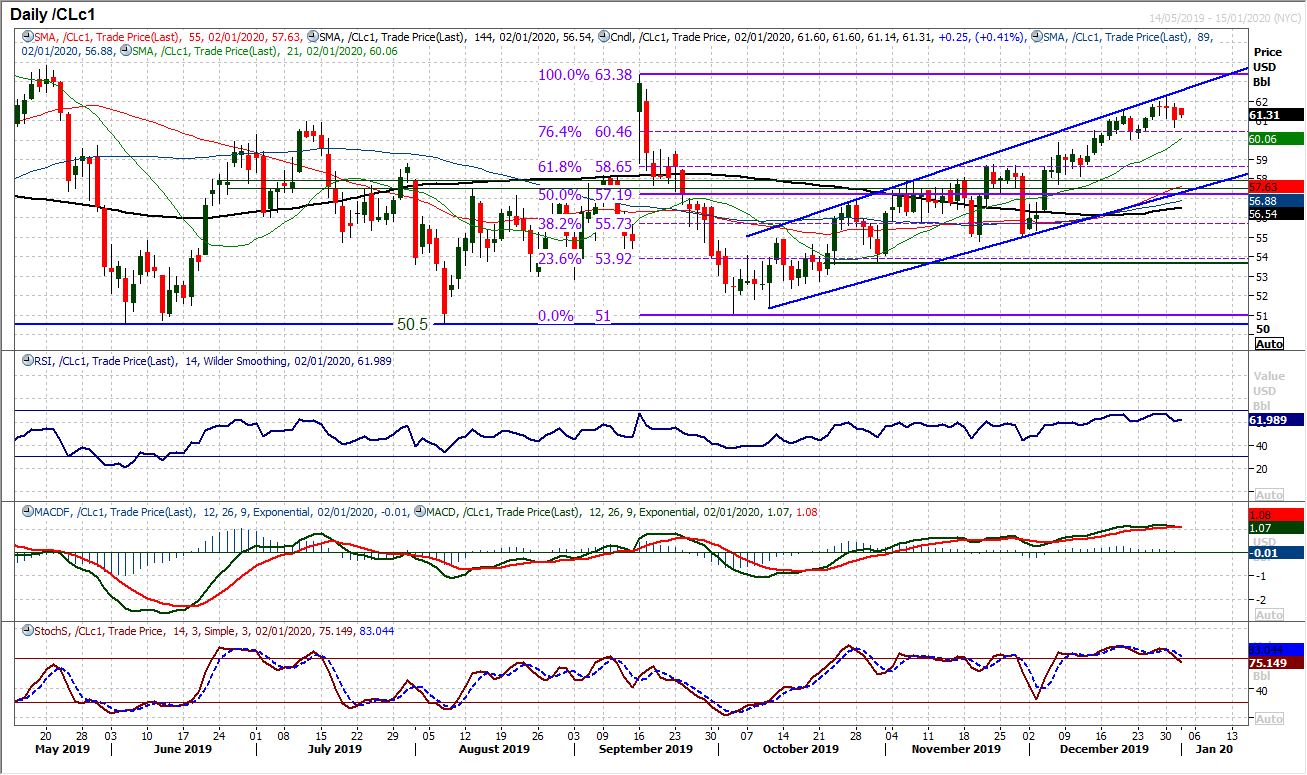
The bulls are hanging on around the top of the uptrend channel although the run higher is beginning to look slightly tired. Trading over the Christmas period should be taken with a pinch of salt and with the low volume/low liquidity, perhaps it is a touch difficult to read too much into moves. However, momentum indicators are beginning to show signs of a slide back. Until the RSI gets below 55, although with a confirmed bear cross on Stochastics and MACD lines, we should not be too worried of a correction. The support at $60.00 is key to watch then. Initial support at $60.65. The top of the channel is $62.15 today whilst $62.35 is price resistance.
Dow Jones Industrial Average
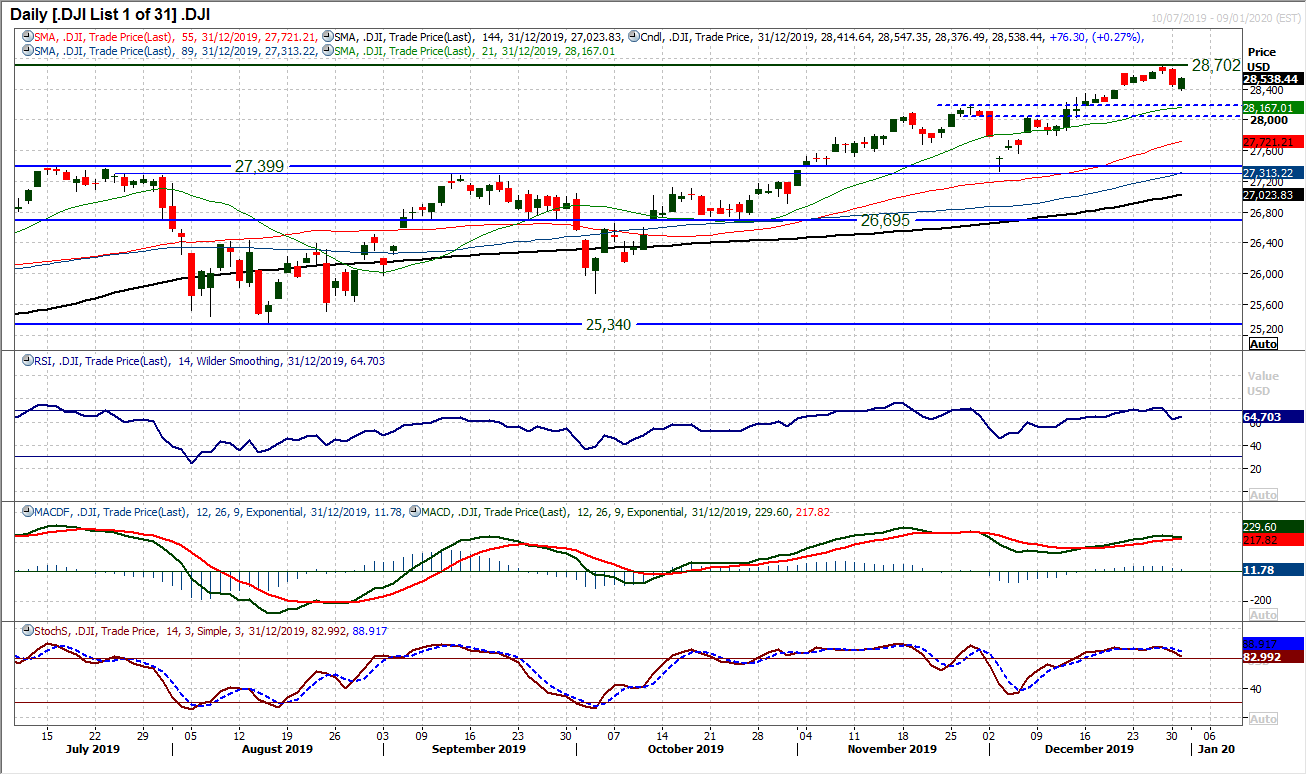
For the past few months, betting against Wall Street has been a bum trade. So using weakness as a chance to buy has tended to be the strategy most akin to a profitable one. The market hit further all-time highs over the low liquidity Christmas season, leaving a high at 28,702. However, although the market slipped back from there, it is likely that this will not be the end of the highs. A decent reaction from the bulls to finish the year has a low in place now at 28,376 but anything that finds support around (or just above) the 28,035/28,175 support band should be seen as an opportunity. RSI is also off its highs but holding in the 60s is positive and MACD lines remain positively configured. We cannot rule out initial weakness, but buying opportunities should still be eyed.
"""DISCLAIMER: This report does not constitute personal investment advice, nor does it take into account the individual financial circumstances or objectives of the clients who receive it. All information and research produced by Hantec Markets is intended to be general in nature; it does not constitute a recommendation or offer for the purchase or sale of any financial instrument, nor should it be construed as such.
All of the views or suggestions within this report are those solely and exclusively of the author, and accurately reflect his personal views about any and all of the subject instruments and are presented to the best of the author’s knowledge. Any person relying on this report to undertake trading does so entirely at his/her own risk and Hantec Markets does not accept any liability. """
