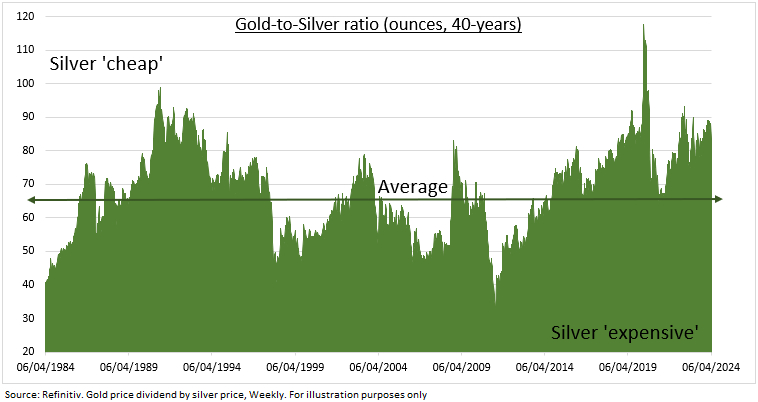
RALLY: Gold (GLD (NYSE:GLD)) prices have broken $2,400 per ounce, setting a new all-time-high, up by 13% this year, and triple the rally of broader commodities. Silver (SLV) prices have done better given their traditional higher beta to gold prices and their low gold/silver ratio valuation versus history (see chart). But it’s been an unbalanced chameleon-like gold rally that brings plenty of risks. The rally has been driven by demand for geopolitical and inflation hedges, alongside central bank demand. With traditional gold drivers lacking. As the US dollar strengthened and bond yields rose. Alongside outflows from gold ETFs and lagging of gold stock proxies (GDX (NYSE:GDX)).
DRIVERS: The rally has been mainly driven by safer haven demand. As geopolitical risks from Ukraine to the mid-East have stayed high, and inflation declines stalled. Whilst central banks have stayed strong gold buyers to rebalance their foreign exchange reserves. But the gold rally foundations are narrow and traditional drivers been lacking. The stronger dollar has depressed demand from overseas buyers. Higher US bond yields have increased the competition for non-yielding gold. Gold ETFs have seen outflows as ‘digital gold’ Bitcoin has dramatically outperformed. This represents a significant generational divide in long term hard-asset demand.
RATIO: The gold/silver ratio, also known as the ‘Mint Ratio’, measures how many ounces of silver are needed to purchase one of gold. The two prices are strongly related with a correlation around 0.8 the past two decades. Whilst silver is historically around twice as volatile, reflecting its smaller market size and more industrial end uses. It currently needs 82 ounces to buy one of gold. This is around 20% above the forty-year average level (see chart). The higher the ratio the ‘cheaper’ silver is relative to gold. Both prices freely trade today but their relationship has been often fixed in the past. At 12:1 during the Roman Empire, and 16:1 in the US during the 1800s.
- English (USA)
- English (India)
- English (Canada)
- English (Australia)
- English (South Africa)
- English (Philippines)
- English (Nigeria)
- Deutsch
- Español (España)
- Español (México)
- Français
- Italiano
- Nederlands
- Português (Portugal)
- Polski
- Português (Brasil)
- Русский
- Türkçe
- العربية
- Ελληνικά
- Svenska
- Suomi
- עברית
- 日本語
- 한국어
- 简体中文
- 繁體中文
- Bahasa Indonesia
- Bahasa Melayu
- ไทย
- Tiếng Việt
- हिंदी
Gold's chameleon-like rally
Latest comments
Loading next article…
Install Our App
Risk Disclosure: Trading in financial instruments and/or cryptocurrencies involves high risks including the risk of losing some, or all, of your investment amount, and may not be suitable for all investors. Prices of cryptocurrencies are extremely volatile and may be affected by external factors such as financial, regulatory or political events. Trading on margin increases the financial risks.
Before deciding to trade in financial instrument or cryptocurrencies you should be fully informed of the risks and costs associated with trading the financial markets, carefully consider your investment objectives, level of experience, and risk appetite, and seek professional advice where needed.
Fusion Media would like to remind you that the data contained in this website is not necessarily real-time nor accurate. The data and prices on the website are not necessarily provided by any market or exchange, but may be provided by market makers, and so prices may not be accurate and may differ from the actual price at any given market, meaning prices are indicative and not appropriate for trading purposes. Fusion Media and any provider of the data contained in this website will not accept liability for any loss or damage as a result of your trading, or your reliance on the information contained within this website.
It is prohibited to use, store, reproduce, display, modify, transmit or distribute the data contained in this website without the explicit prior written permission of Fusion Media and/or the data provider. All intellectual property rights are reserved by the providers and/or the exchange providing the data contained in this website.
Fusion Media may be compensated by the advertisers that appear on the website, based on your interaction with the advertisements or advertisers.
© 2007-2024 - Fusion Media Limited. All Rights Reserved.
