With competing “stores of value” like Silver and Bitcoin (…and even more esoteric investments like art and rare sports cards) grabbing all the headlines lately, interest in buying Gold has waned.
Over the last six months, the world’s oldest store of value has spent most of its time consolidating between $1800 and $2000, frustrating bulls and bears alike. Notably, this period also includes a resurgence of the worst global pandemic in a century, general weakness in the US dollar, rioters storming the US Capitol, and policymakers across the globe committing to ongoing stimulus for years to come; in other words, gold has failed to rally despite many developments that would traditionally drive the yellow metal higher.
Historically, real interest rates have been one of the best indicators for the price of gold. Calculated as the yield on inflation-indexed bond, real interest rates represent the estimated opportunity cost of holding gold.
When real interest rates are low or negative, investment alternatives like cash and bonds tend to provide are less attractive, pushing investors to seek alternative ways to protect the value of their wealth. On the other hand, when real interest rates are high, strong returns are possible in cash and bonds, and the appeal of holding a yellow metal with few industrial uses diminishes.
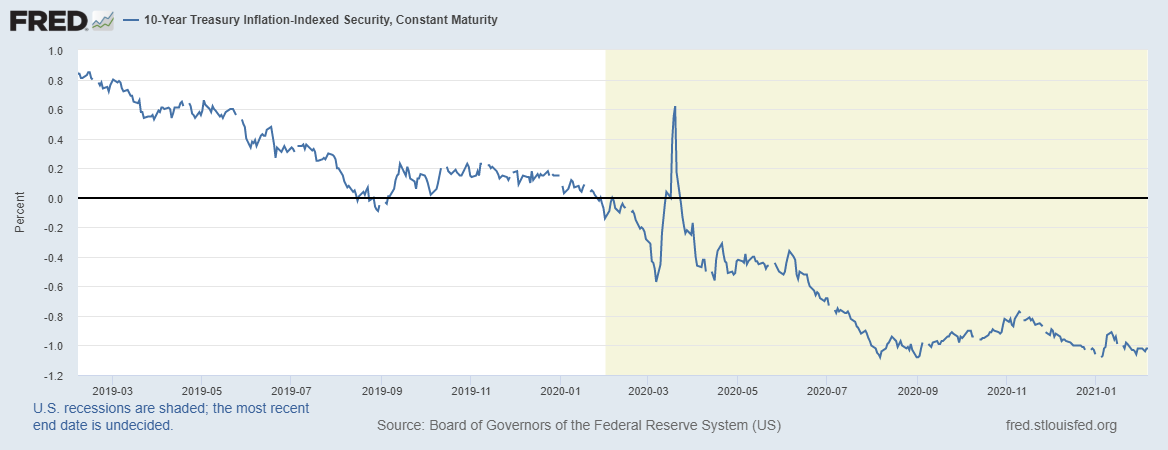
Beyond the opportunity cost of holding gold, interest rates also play a role in the cost of funds when buying gold on margin, as many traders do. One easy way to see a proxy for real interest rates in the United States, the world’s largest economy, is to look at the yield on Treasury Inflation Protected Securities (TIPS). As the chart below shows, the yield on 10-year TIPS have generally fell over the last two years to yield roughly negative 1% as of writing, theoretically a tailwind for gold prices:

Despite the disappointing price action (for bulls) so far, the current macroeconomic backdrop remains favourable for gold prices.
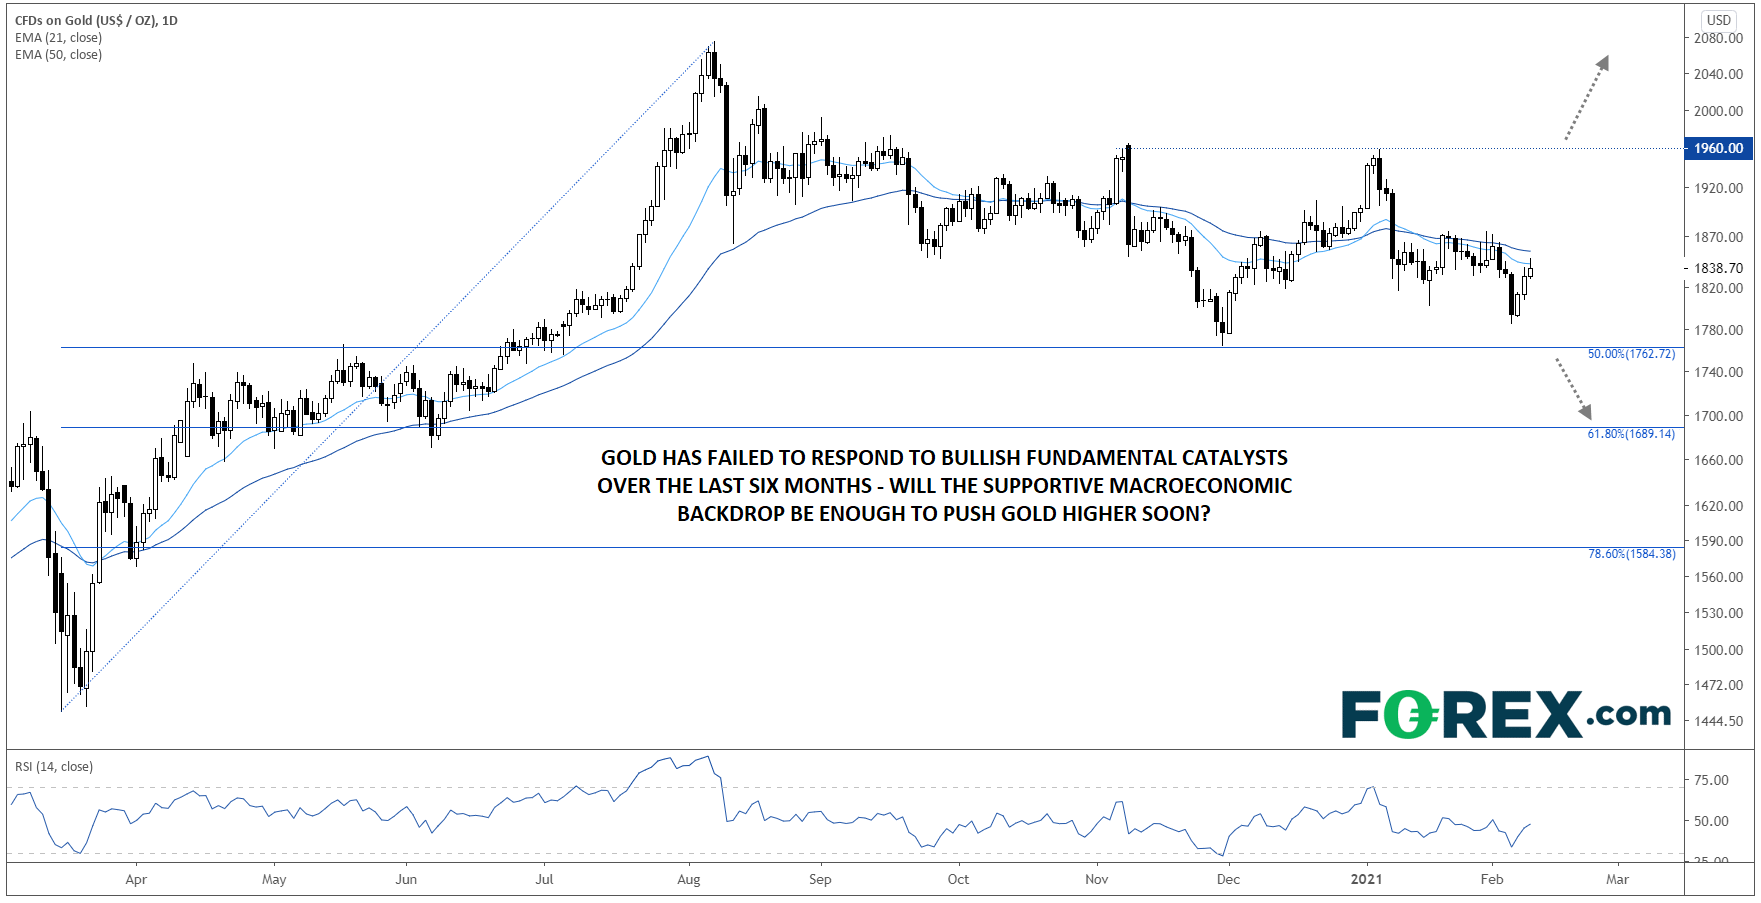
Turning our attention to the chart, we can see that gold has retraced just 50% of its Q2-3 2020 rally so far, indicating that from the medium-term perspective, bulls remain in control of prices for now. If that support level near $1760 is broken, a deeper retracement toward $1700 (the 61.8% Fibonacci retracement) or $1600 (78.6%) may be next.
On the other hand, while the generally supportive fundamental backdrop may be reason enough for some traders to buy, more conservative investors may want to wait for a bullish breakout above resistance near $1960 to confirm that the market is recognizing the bullish case. If that near-term resistance level gives way, Gold could quickly extend up to its record highs near $2075 or higher in short order:

