With conviction about the recovery from COVID-19 growing by the day, the price of every commodity is reaching for its pre-pandemic dynamism. For gold, nothing could be worse.
Unlike oil or copper, gold’s glory was etched during the lockdown days or, more precisely, before the vaccine breakthroughs that gave hope that the end was nigh for the life the world had come to accept in the past year.
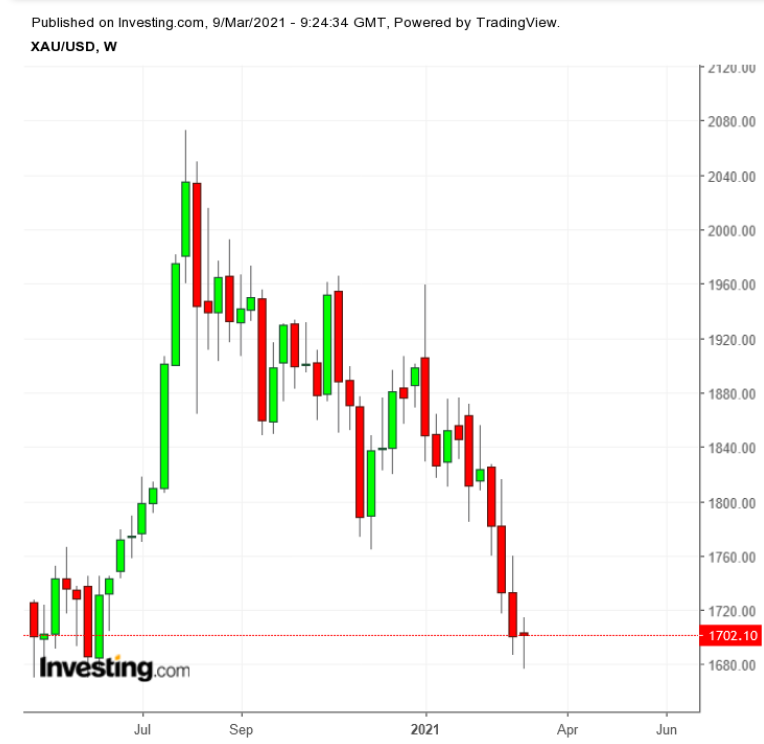
Gold prices rose more than $600 or 40% from the lows of 2020 to reach record highs of nearly $2,100. A reversion to the mean wouldn’t just undo the most brilliant rally in gold’s history. It would also expose those holding long positions in the yellow metal to a drearier bear market than they’re in now.
As it stands, gold is already the worst performing commodity of 2021, down 11%. The commodity with the second largest loss for the year is orange juice, which is down 9%. Oranges, due to their dazzling color, are often called the gold that grows on trees.
At Monday’s 11-month low of around $1,676, the spot price of gold, which reflects trades in bullion, was down $396, or 19%, from its August record high of around $2,073.

Futures of gold, meanwhile, touched an April 2020 low of around $1,673, losing $416, or 20%, from an all-time high of $2,089 in August. Any market that has dropped 20% or more from its recent high amid widespread pessimism and negative investor sentiment is defined as a bear market. Gold futures already fit the bill.
More Risks May Await Gold Bulls
But turning the clock further back on gold will expose its longs to even lower pre-pandemic prices. At first risk is the March 2020 low of nearly $1,452 on the spot price. Further down is the September 2019 trough of almost $1,400.
What’s happening to gold is virtually incomparable to any other major commodity.
US crude, for instance, is trading near its October 2018 high, having breached $67 per barrel Monday. Copper is pursuing record highs of almost $4.50 per lb set in September 2011. Soybeans are chasing 2014 peaks of almost 14.60 per bushel and coffee, trading just below $1.40 per lb, is nearing September 2017 peaks. All these markets seem to carry “growth stories” aligned with one of the most vibrant economic recoveries ever projected from a recession.
Bonds Yields Killing Gold
Gold has a powerful story too—the possibility of runaway inflation from fiscal deficits and new debt in the trillions that the Biden administration will be pumping into the recovery machine. For decades, gold has been touted as the best hedge against inflation. Moody’s Analytics Mark Zandi warns that Wall Street is significantly underestimating the seriousness of an inflation comeback from Biden’s recovery plan, saying it will affect every corner of industry—from big tech to cyclical trades.
The problem for gold is that bond yields will be at the epicenter of any inflation that emerges from this recovery.
Yields benchmarked to the US 10-year Treasury note, which hit February 2020 highs lately, were what killed the rally in non-yielding gold. Those yields were also what drove the dollar, the contrarian trade to gold, higher, adding to the pain of the longs in the yellow metal.
Moody’s Zandi says the US 10-year note could soar to levels beyond the Federal Reserve’s imagination in the coming months.
Markets do surprise, and gold prices could swing back anytime without warning. No one knows what level of descent it will take to trigger such a recovery.
The profusion of algorithmic trading models that buy and sell huge quantities of every tradable security also makes it harder to call a low for gold in this environment, particularly when multiple risks assets serve as a guide.
With yields and the dollar dollar pressuring most markets to reverse to pre-pandemic dynamics, it is getting increasingly hard for gold to catch a break.
Battered RSI May Be Gold’s Best Hope
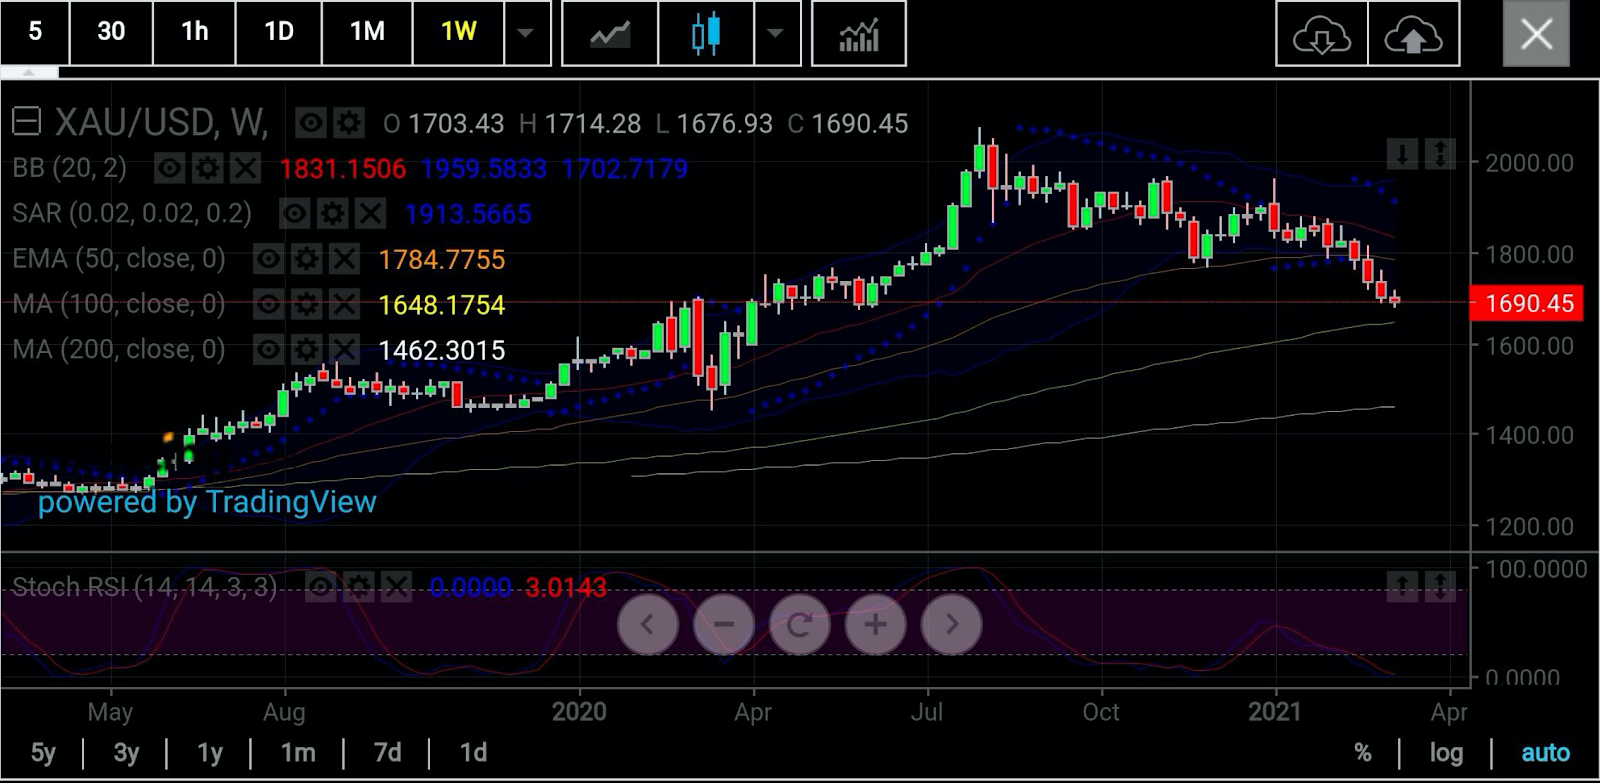
A study of gold’s stochastic Relative Strength Index, or RSI, indicates severe overbought conditions and a chance to return to $1,800 territory, said Sunil Kumar Dixit of SK Dixit Charting in Kolkata, India.
But before that, more pain points could be on the way for gold longs, he says, adding:
“The Monday low of $1676.93 in spot gold may not be enough. Bears have been aiming for the 100-week SMA (Simple Moving Average) currently positioned at $1,648. This has a credible potential to act as strong support in the event of a free fall which markets have witnessed.”
Dixit said a bounce back to $1785, marking the 50-week EMA, or Exponential Moverage, was likely from that point onwards, building toward $1,831, which will mark a 20-week SMA.
“One thing’s for sure: The stochastic RSI is in extreme oversold territory with readings of zero to 3. But any up move will be conditioned by the spot price holding above $1,720. That will be the challenge. Otherwise a move further under $1,648 could open up.”

Chart courtesy of SK Dixit Charting
Jeffrey Halley, senior markets strategist for Asia Pacific at OANDA, agrees that the gold battered RSI could be its boon as much as bane:
“One hope of respite lies in gold's RSI moving into oversold territory. I suspect that gold will limit losses to $1680 over the subsequent few sessions as markets negotiate this week's US bond auctions.”
“That said, I believe we are entering into a range-trading scenario, and it is hard to see gold managing to rise through $1,720 an ounce this week. the most likely scenario remains some side-ways consolidation followed by another significant fall targeting the $1600.00 an ounce area.”
Disclaimer: Barani Krishnan uses a range of views outside his own to bring diversity to his analysis of any market. As an analyst for Investing.com he presents divergent views and market variables. He does not hold a position in the commodities and securities he writes about.
