Market Overview
Markets continue to react to the significant flare up in tensions between Iran and the US in the wake of the US airstrikes which killed Iranian General Soleimani. A destabilised Middle East pulls the oil price higher as a primary impact. Threats to the supply of oil through the Strait of Hormuz (just over a fifth of the world’s oil supply runs through this narrow stretch of the Persian Gulf) have driven the price of oil around 5% higher since Friday’s announcement.
There has also been a shift in flow back into safe haven assets which remains a key factor in all this. Gold is again well over a percent higher this morning, jumping to multi-year highs, whilst the yen is still being has been favoured and on the flip-side equities are under pressure. However, geopolitical shocks are often absorbed fairly quickly by markets, so there is risk in chasing these moves. The extremely overbought positioning on gold is especially interesting from this standpoint.
Already this morning, we are beginning to see a degree of unwind playing out through Treasury yields. Whilst there is still a safe haven bias in forex markets, the moves seem to be a little more contained this morning too. Newsflow will be a key factor in the coming days, but could the geopolitical risk already be factored in?
Wall Street closed lower on Friday, with the S&P 500 -0.7% at 3235, with US futures another -0.4% lower today. Asian markets have been mixed, with the Nikkei playing catch up -1.9% but the Shanghai Composite -0.1%. European market are still lower, with the FTSE futures following the US being -0.4% lower, whilst DAX futures are -0.7% lower. In forex, there is more of a settled look, although AUD and NZD are again underperforming it is on a marginal basis. EUR has found some support.
It is in commodities where the big moves continue to play out, with gold and silver again well over +1% higher, whilst oil is closer to +2% higher.
The December services PMIs are the main focus for the economic calendar today. European data is early in the session, culminating in the Eurozone final Services PMI at 09:00 GMT which is expected to see the flash reading of 52.4 confirmed (which would be up from 51.9 in November).
This would leave the Eurozone final Composite PMI at 50.6 again (50.6 in November). Then on to the UK final Services PMI at 0930GMT which is expected to remain in contraction at 49.1 (up marginally from the flash reading of 49.0, but down from the final November reading of 49.3). This would leave the final UK Composite PMI at 48.6 (down from 49.3 in November). The Eurozone Investor Confidence indicator is also at 0930GMT and is expected to improve to +2.6 (from +0.7 in November).
Chart of the Day – AUD/USD
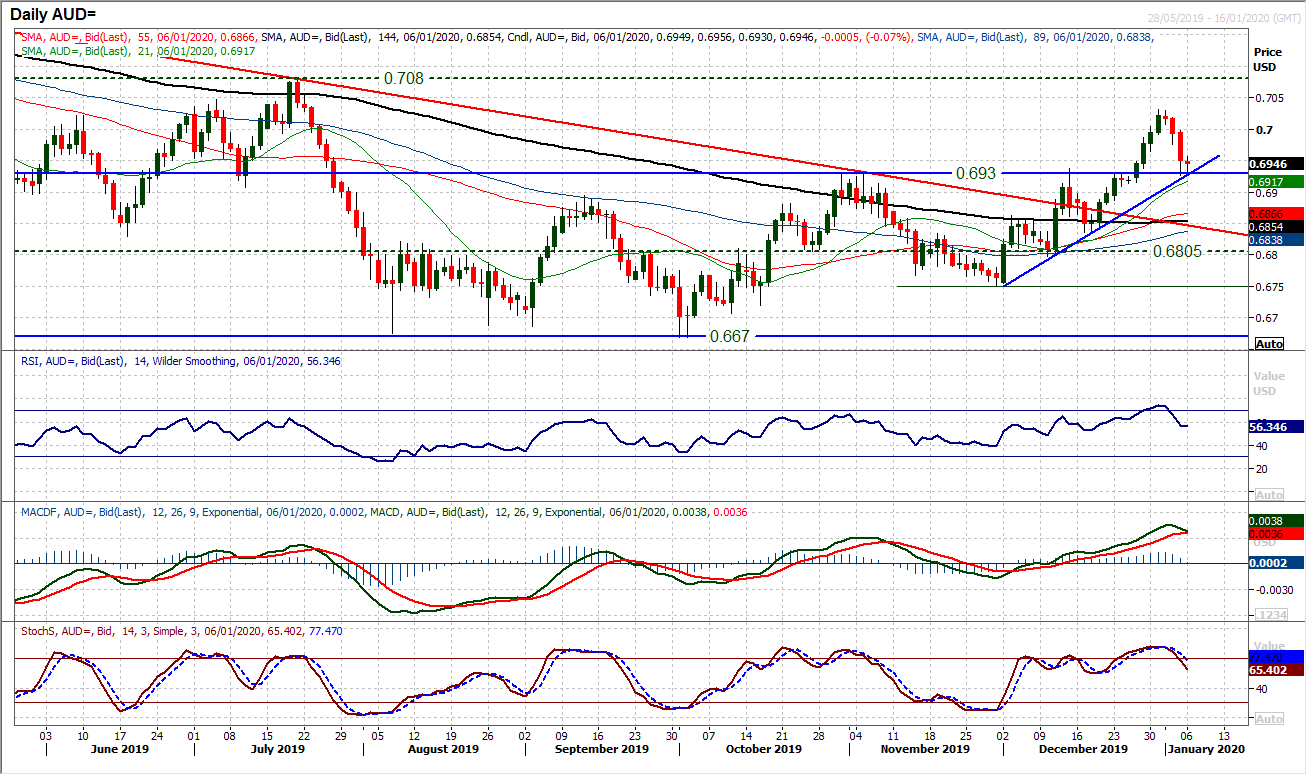
After a great month for the Aussie in December, January has come with an early retracement as risk appetite has been hit. The question is now whether supports can hold. The key breakout above $0.6930 finally seemed to find upside traction at the end of December, but a stretched RSI has been met with a near term correction. As profits have been taken the market has retreated to the confluence of the breakout support around $0.6930 and a five week uptrend. This support held on Friday, but is being tested again early on Monday. Notably, the unwind on momentum is within positive medium term configuration. The RSI is still above 50 with only slight tweaks lower on MACD and Stochastics. Given the support at the $0.6930 breakout on Friday, if the market can continue to build support today it will be seen that this is a crossroads that the bulls can use as an opportunity. However, the selling pressure is still in force for now and the risk is for continued correction. Below $0.6910 would be below the 21 day moving average (today at $0.6917) which has been a decent gauge since early December. It would open $0.6805 again. Resistance is clear at $0.7030.
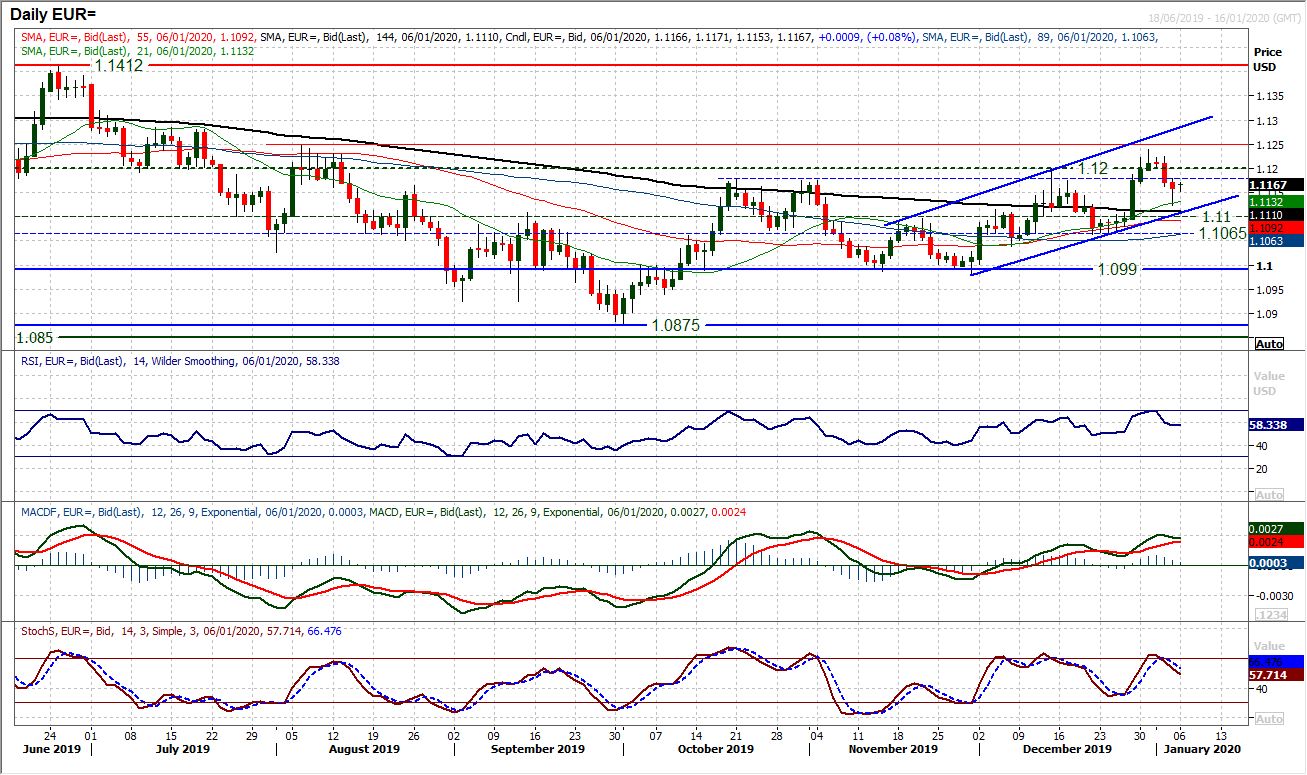
The market has been in an uptrend channel of the past six weeks. Another retreat in early December has so far been once more met with support. With the positive configuration on momentum indicators, the outlook remains broadly positive to buy EUR/USD into weakness. The bottom of this six week channel comes in at $1.1110 today which is above the $1.1100 pivot line (also supportive) whilst the rising 21 day moving average also continues to be a good gauge of support (has supported the downside since early December). The bulls also reacted well on Friday with a rebound from $1.1125, and with momentum indicators still positively configured (near term unwinding move within positive medium term configuration) there is still much to be positive about EUR/USD. The bulls will look to push back above the resistance band $1.1180/$1.1200 which has been historically restrictive, but we are still happy to buy into weakness. Below $1.1100 would question our view, with below $1.1065 confirming a breakdown.
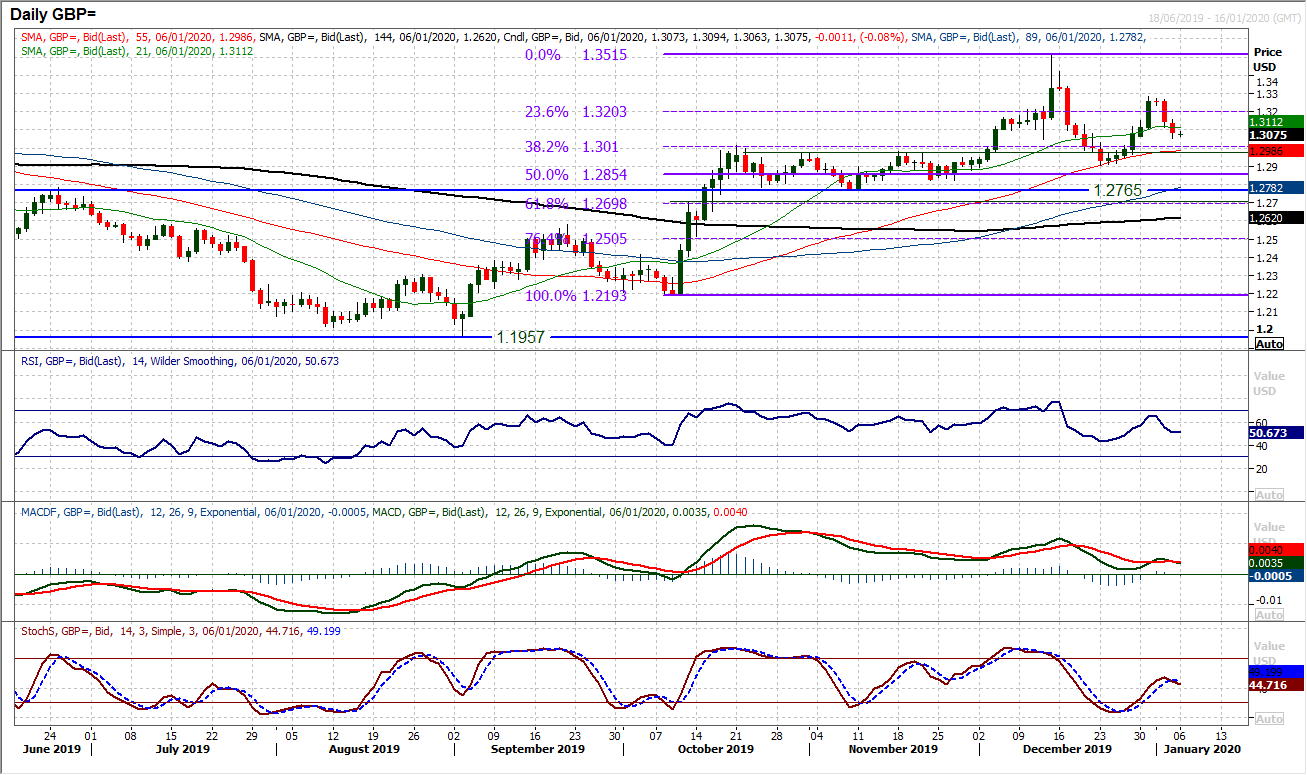
Sterling has begun 2020 with a bit of a splutter. It looked as though the dollar weakness into the new year would drive positive traction through Cable once more, but a retracement has set in. However, although this is a rather messy looking chart for now, we see Cable positive above $1.3000. The breakout above $1.3010 was key in December, whilst a correction that found support at $1.2900 means that there is a key band of support now $1.2900/$1.3010. The 38.2% Fibonacci retracement (of $1.2192/$1.3515) also at $1.3010 makes this a key gauge of support too. Momentum is a little mixed near term, but still positive on a medium term basis to lend support to the strategy to buy into weakness. The market looks fairly settled moving into Monday morning and we are on the lookout for renewed positive signals in the days ahead. Initial support at $1.3050 today, whilst resistance is $1.3110/$1.3160.
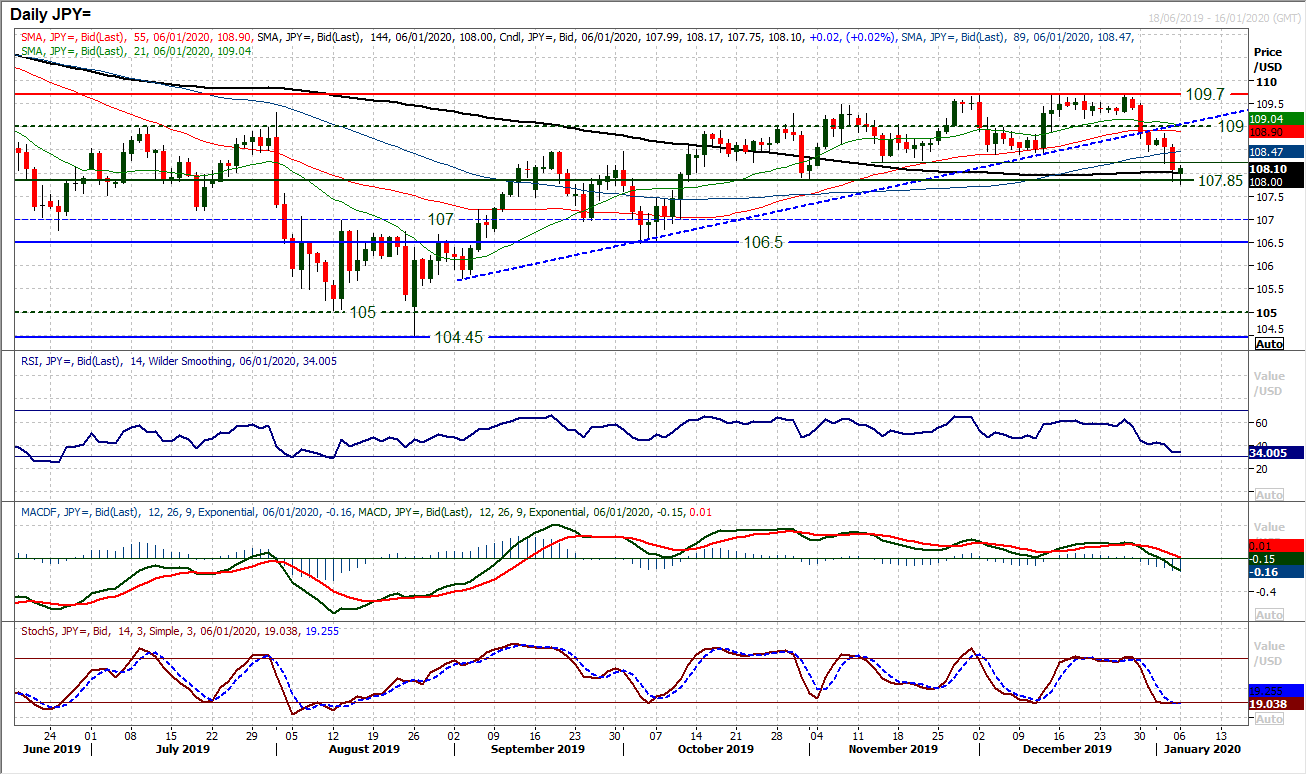
Breaking the supports at 108.40 and 108.25 means that another key support looms to be tested at 107.85. Despite an intraday breach early this morning, there would need to be a decisive closing breach to be seen as a confirmation of a breakdown. However, looking at the deterioration in momentum, it would suggest that this support will come under increasing scrutiny. The RSI in the mid to low 30s and multi-month lows, along with MACD lines ready to move below neutral for the first time since September adding to the increasingly corrective outlook. The magnitude of the bear candles recently suggests that intraday rallies are now a chance to sell. Resistance of the overhead supply comes in between 108.25/108.60 which is a near term “sell-zone”. The corrective aspect to the chart will remain in force until a break back above the old pivot at 109.00.
Gold
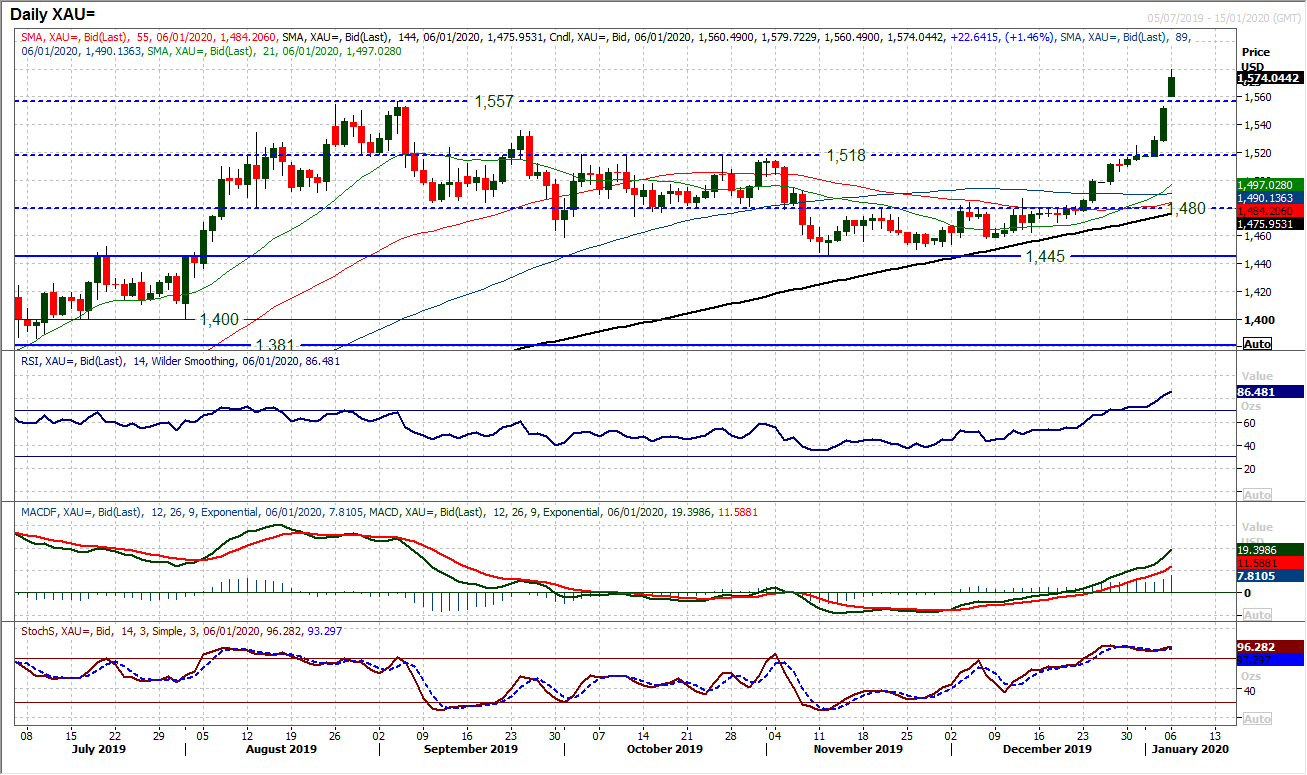
The drive higher on gold over the festive period was given rocket boosters on Friday’s geopolitical news. The market has paid scant regard for the 2019 high of $1557, gapping through the resistance to a new high dating back to 2013. The market has been on a big bull run ever since the breakout above $1480 and has shown little sign of stopping. However, the one caveat is that the market is increasingly stretched. Gold is trading entirely outside the 2.0 SD Bollinger Bands today (the upper band is at $1556 currently). Furthermore, the RSI is into the high 80s now which is becoming extremely stretched. These conditions show the bull run is extremely strong, but excessive too. Care must be taken with chasing gold higher in this situation. Profit-taking is increasingly possible now. There is a gap at $1553 from Friday’s high, whilst $1557 is the old key high which is also a basis of support now. The next resistance is $1600 (psychological) and minor at $1616 (May 2013 high, but is little realistic resistance.
WTI Oil
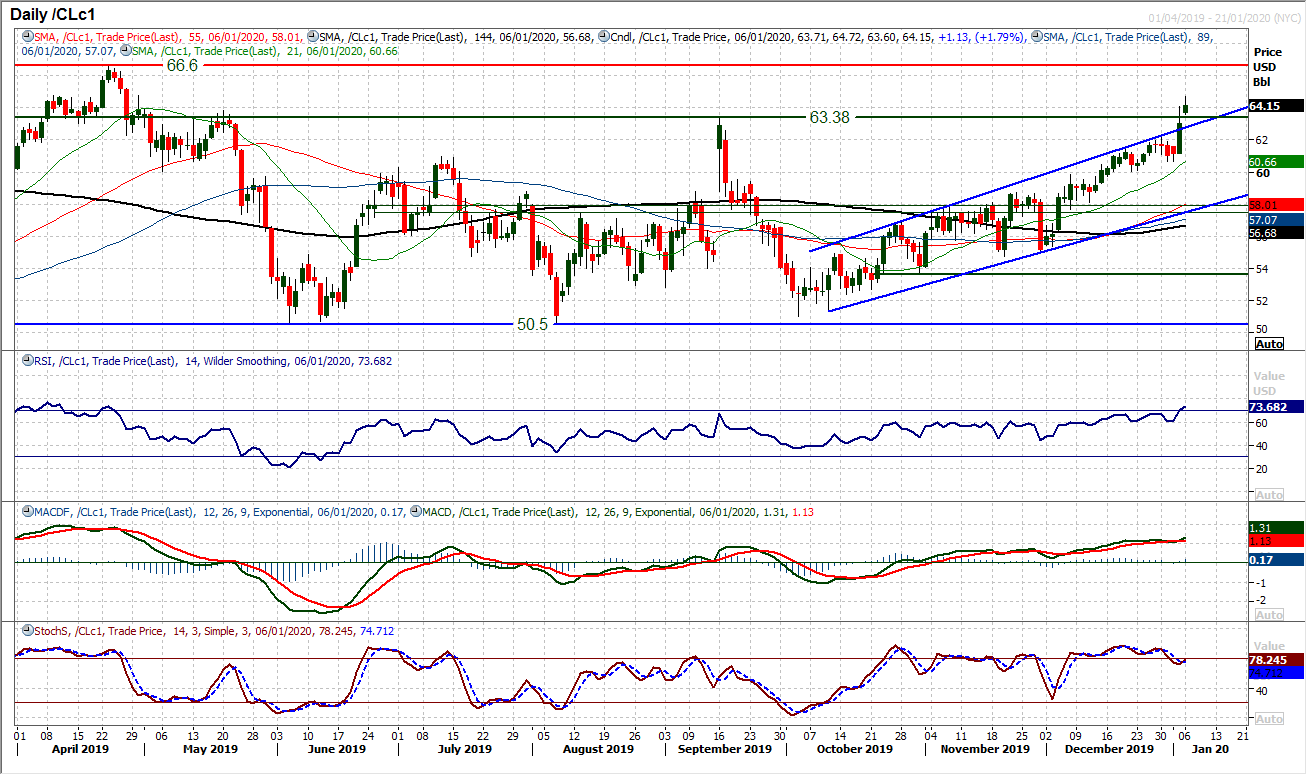
A strong spike higher on Friday and another move higher in early trading today. Oil remains on the bid. A breakout above the trend channel highs has also once more taken the market well clear of the previous key resistance at $63.40. This has opened $66.60 (the April 2019 high). Momentum is strong as the RSI moves into the 70s, whilst MACD and Stochastics are also configured positively. The old channel high (at $62.90) and old high of $63.40 is now a basis of support too. Clearly there is still elevated volatility in the oil market from the uncertain fundamental picture in the Middle East and with this is yet to settle down, then it could lead to some erratic trading. However, the technical outlook has been given a shot in the arm. How long this lasts is difficult to say.
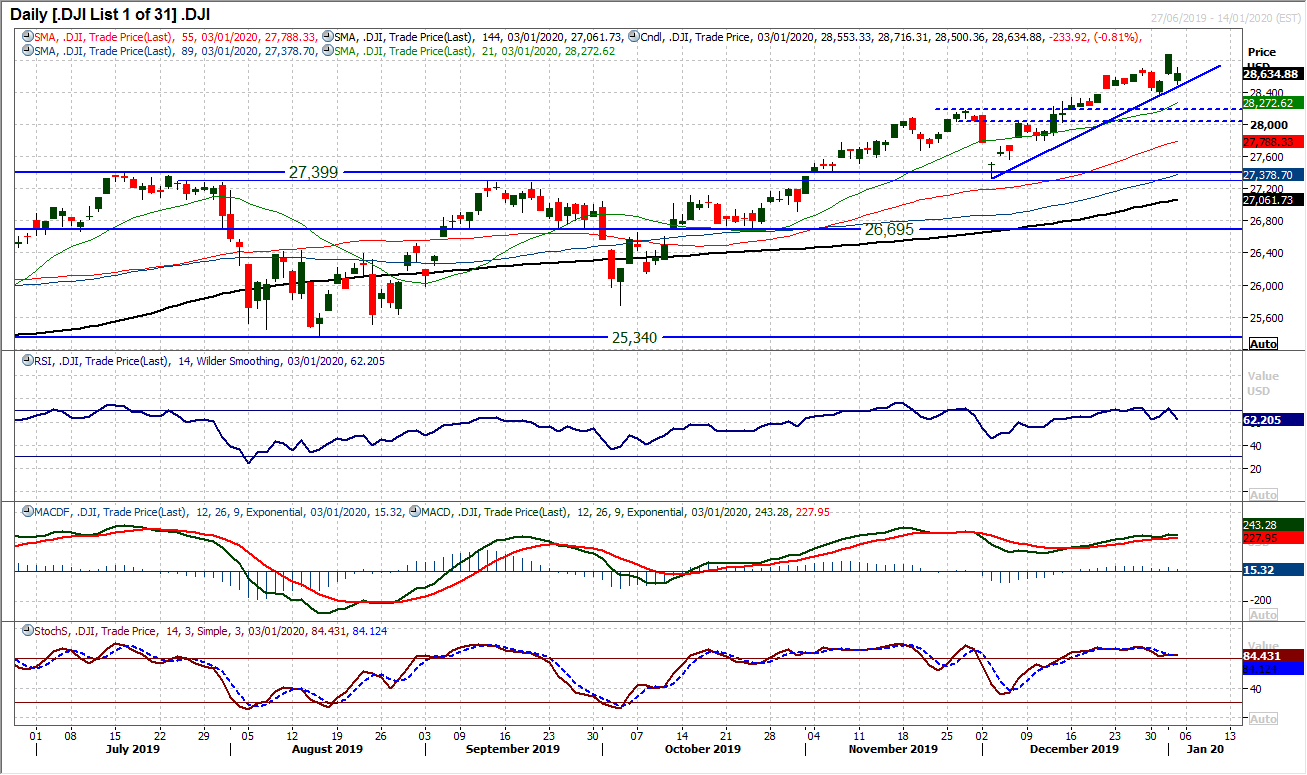
Wall Street reacted lower on Friday to the spike in geopolitical tensions in the Middle East. However, it was interesting to see that the initial move has not yet formed any corrective signals. There is an uptrend of the past four weeks still intact, whilst the first higher low of the recent break to all-time highs at 28,376 is also still holding. Momentum indicators have slipped lower, but again not with any explicit negative signals. However, this could all change quickly, with the futures again pointing lower today (by around -0.3%). A retreat back towards the breakout support band 28,035/28,175 is still possible but it will be the reaction from the bulls to any selling phase that will be key. The market has been strong for a while now, but with little real profit-taking. Could this be an early trigger?
"""DISCLAIMER: This report does not constitute personal investment advice, nor does it take into account the individual financial circumstances or objectives of the clients who receive it. All information and research produced by Hantec Markets is intended to be general in nature; it does not constitute a recommendation or offer for the purchase or sale of any financial instrument, nor should it be construed as such.
All of the views or suggestions within this report are those solely and exclusively of the author, and accurately reflect his personal views about any and all of the subject instruments and are presented to the best of the author’s knowledge. Any person relying on this report to undertake trading does so entirely at his/her own risk and Hantec Markets does not accept any liability. """
