Market Overview
Risk appetite has taken a hit as President Trump has discussed the prospect of raising tariffs further on China if there is no agreement reached on “phase one”. This could still be part of his carrot and stick approach to negotiation, but it is spooking markets which had been positioning towards the two countries coming towards a deal. Treasury yields are falling, whilst the yen is taking renewed strength and gold is also edging higher. Watching the Dollar/Yuan rate pulling back higher again decisively higher from 7.00 again shows the concern is growing. Equity markets are also starting to feel the pinch of some profit-taking after some strong runs higher in recent days/weeks.
The reaction to these moves will be very interesting now. If there is a containment to the flow into safe havens, then it would suggest that once the initial knee jerk response is factored in, there would still be an expectation that the US and China will be working to a deal. Aside from this, tonight we get the FOMC minutes. It will be interesting to see how cautious (or not) the Fed was at a meeting of a -25bps rate cut. The market seems fairly set in its assessment that the Fed is now on hold for the foreseeable future.
Wall Street closed lower with the S&P 500 -0.1% at 3120 whilst US futures are another -0.2% back today. Asian markets have been broadly corrective today with the Nikkei -0.8% and Shanghai Composite -0.7%. In Europe there is a less corrective but still cautiously negative open, with FTSE futures -0.1% and DAX futures -0.4%.
In forex, there is a mild risk negative and dollar positive theme, with JPY, USD and CHF all performing well. In commodities, the mild drift higher on gold continues, whilst there is little sign of any rebound on oil after the selling pressure of the past couple of days.
It is another quiet European morning on the economic calendar, and in fact, it pretty much stretches into the US session too. Very light data with just Canadian inflation at 13:30 GMT which is expected to remain at +1.9% in October (+1.9% in September).
The EIA oil inventories are expected to show crude stocks building by +1.1m barrels (+2.2m barrels last week), whilst distillates are expected to drawdown by -0.5m barrels (-2.4m barrels) and gasoline stocks to build by +0.7m barrels (+1.8m barrels last week). The key announcement of the day is with the FOMC minutes for the meeting on 30th October. There is a widespread expectation of the Fed now being on hold for now for some time to come, so any hawkish or more likely dovish deviation in message from the minutes could be market moving.
Chart of the Day – EUR/NZD
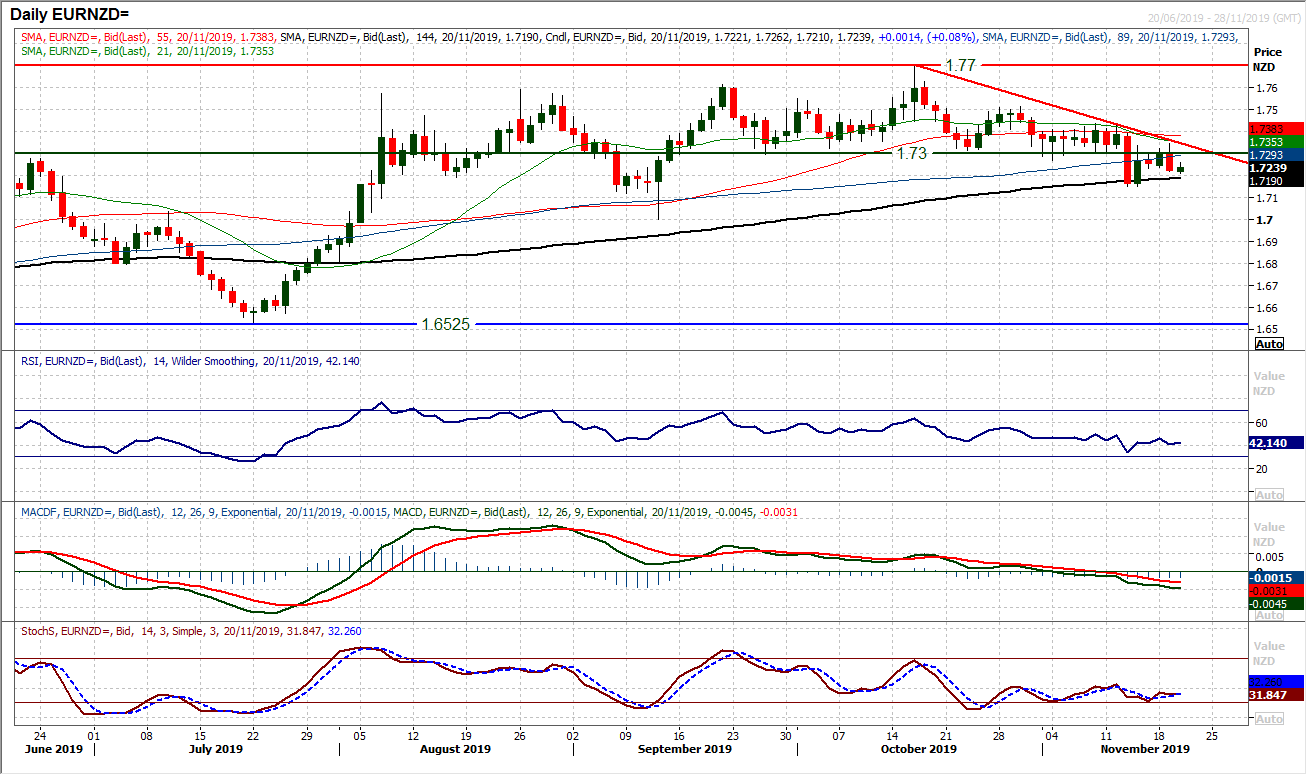
We have seen the euro relative performance through major cross pairs suffering in recent weeks. With the RBNZ holding back from an expected cut the Kiwi has strengthened in a move that has broken EUR/NZD below the old pivot band support at 1.7300. With yesterday’s session forming a bearish engulfing candlestick, this looks to be a renewed sell signal. Forming a one month downtrend, following the breakdown, the now falling 21 day ma (around 1.7350) is a basis of resistance. The old support at 1.3700 is also a basis of resistance in recent days. With momentum indicators taking on an increasingly corrective configuration, rallies into the resistance area 1.7300/1.7350 are a chance to sell. The RSI continues to fall over at lower levels, whilst the MACD lines are falling at three and a half month lows. We see pressure for a retest of the recent low at 1.7150 whilst the September low at 1.7000 is also back within range. The bulls would need a close above resistance at 1.7435 to regain positive momentum.
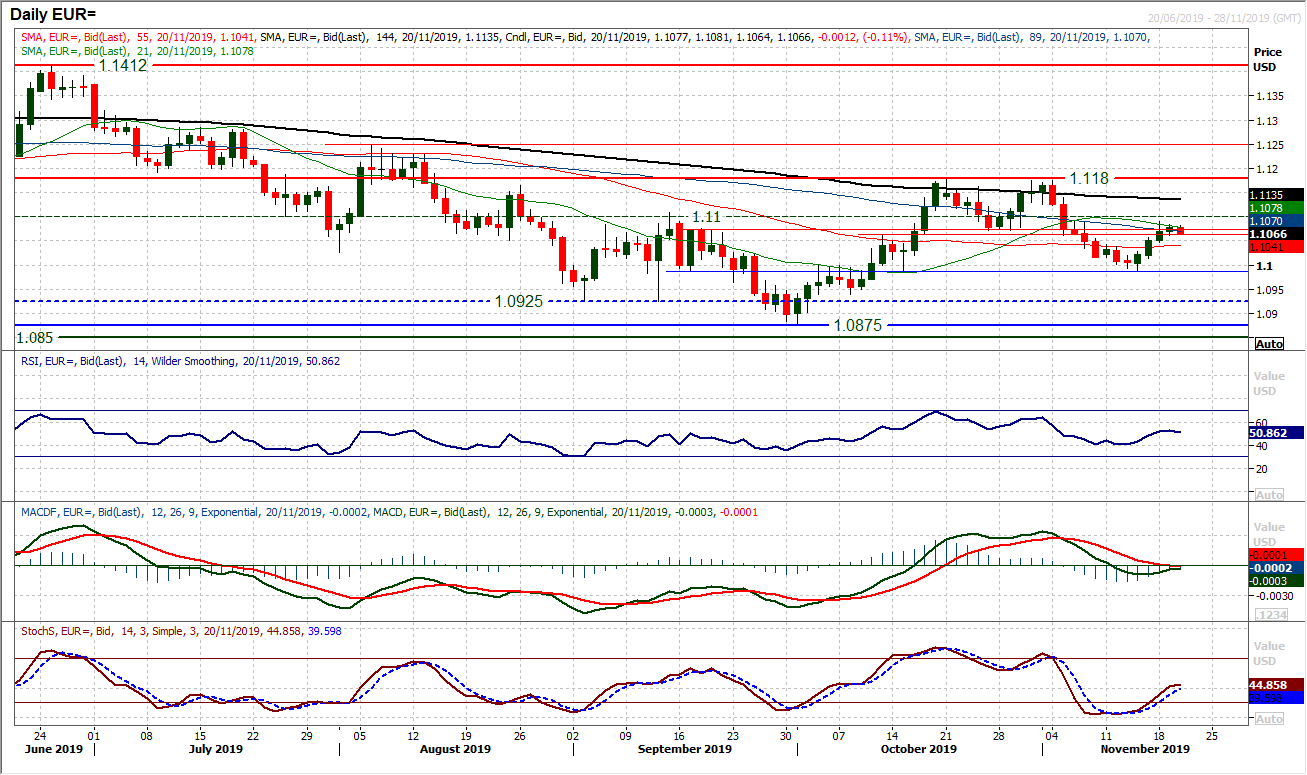
The euro rebound of the past week has just hit the buffers slightly in the last couple of sessions. Monday’s rally high of $1.1090 has taken on a marker of resistance as an element of consolidation has set in. The fact that this is playing out around the old $1.1060/$1.1075 pivot band is also interesting. Whilst not to the pip, it appears that this is a neutral area within what is an increasingly rangebound outlook on EUR/USD. This is reflected in the momentum indicators losing traction around their neutral points (c. 50 on RSI and Stochastics, around zero on MACD). The hourly chart shows that the near term rally has lost traction, with the hourly RSI, MACD and Stochastics all tailing off to their lower levels in several days. There is initial support at $1.1040/$1.1060 which if breached opens $1.0990 again. Above $1.1100 would be a signal for renewed positive traction towards $1.1180. We sit neutral on EUR/USD waiting for the next signal.
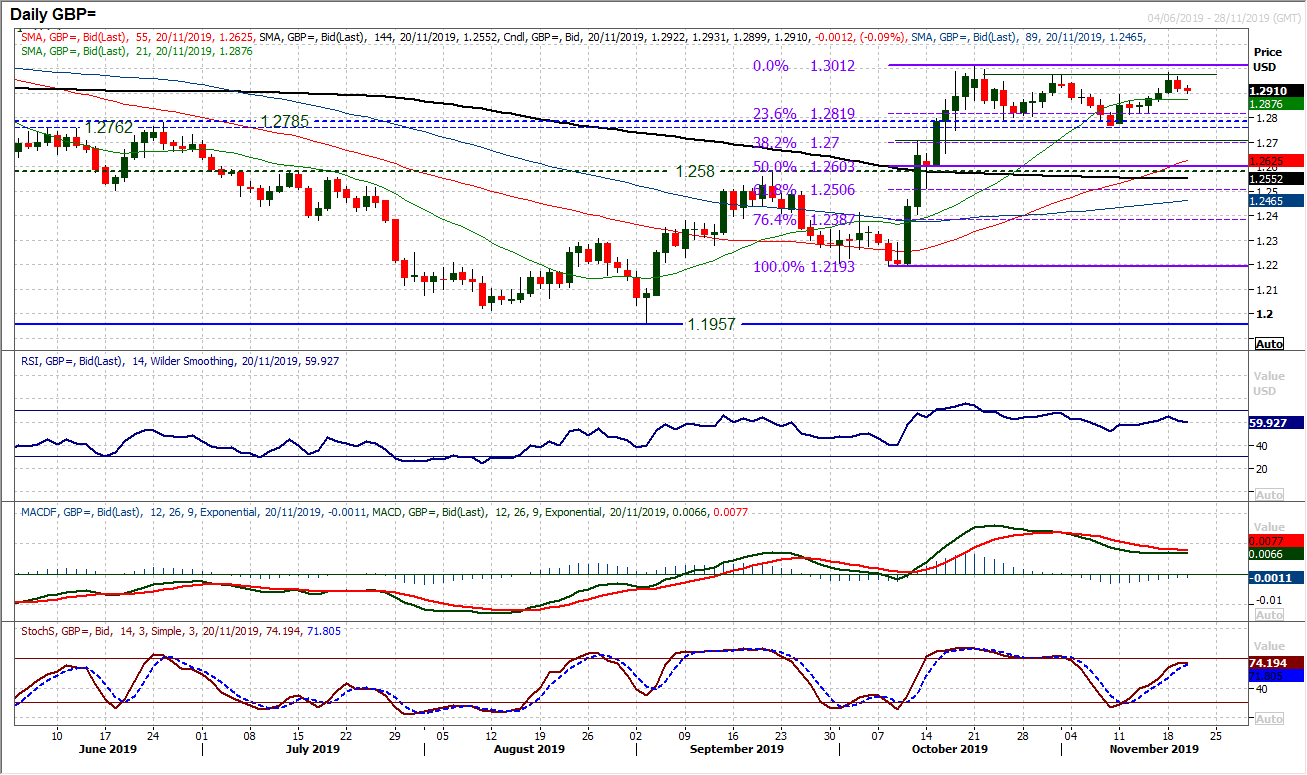
Once more the Cable rally has tailed off around the $1.2975/$1.3010 resistance of the past few weeks and the range formation is kicking in again. We continue to see GBP/USD as a growing near to medium term consolidation pattern between probably $1.2700/$1.3000 in the run up to the UK election and with yesterday’s negative candle we see this as an increasing likelihood. With momentum indicators still in their retracement modes, another unwinding move looks to be on. Back below initial support at $1.2900 opens $1.2865 and then $1.2820. Having lost the positive traction, hourly indicators are taking a more neutral configuration. Watch for hourly RSI moving below 30 for a build up of corrective momentum. Initial resistance now $1.2930.
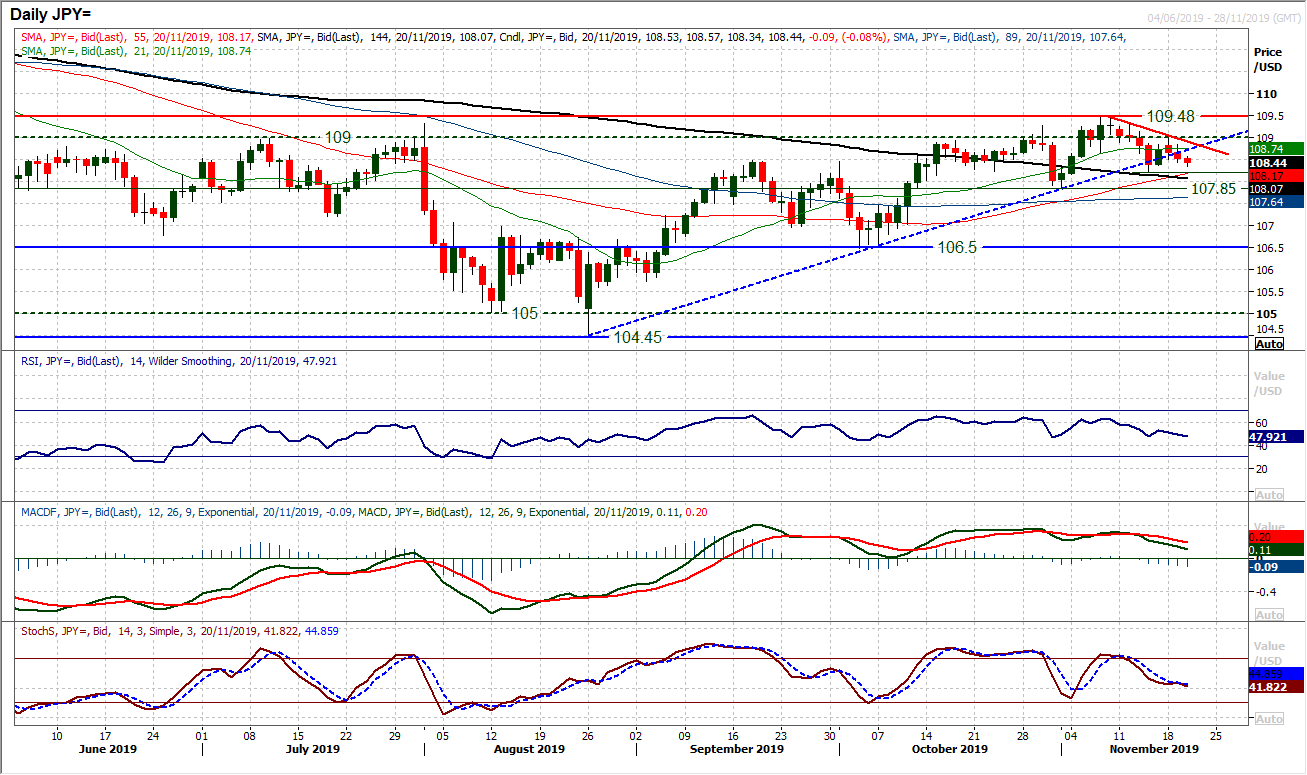
The price action on Dollar/Yen in the last couple of sessions will have given the bulls an increasing cause for concern. Given the breaches of the old 11 week uptrend are increasingly common, Monday’s failure around 109.05 (around the resistance band 109.00/109.50) has since been followed by a couple of negative candles. Tuesday’s negative candle really does now suggest the bulls have lost control with a confirmed breach of the uptrend. Although the momentum indicators are all still positively configured on a medium term basis, they are turning corrective on a near term outlook. The focus is now on the support at 108.25 which if breached (especially on a closing basis) there would be a run of lower highs and subsequently lower lows. This would be the early development of a new downtrend. Already we see o the hourly chart a more corrective configuration forming on hourly RSI and also hourly MACD. Below 108.25 opens the next key low at 107.85 which is the key near to medium term support. Initial resistance now 108.65/108.85.
Gold
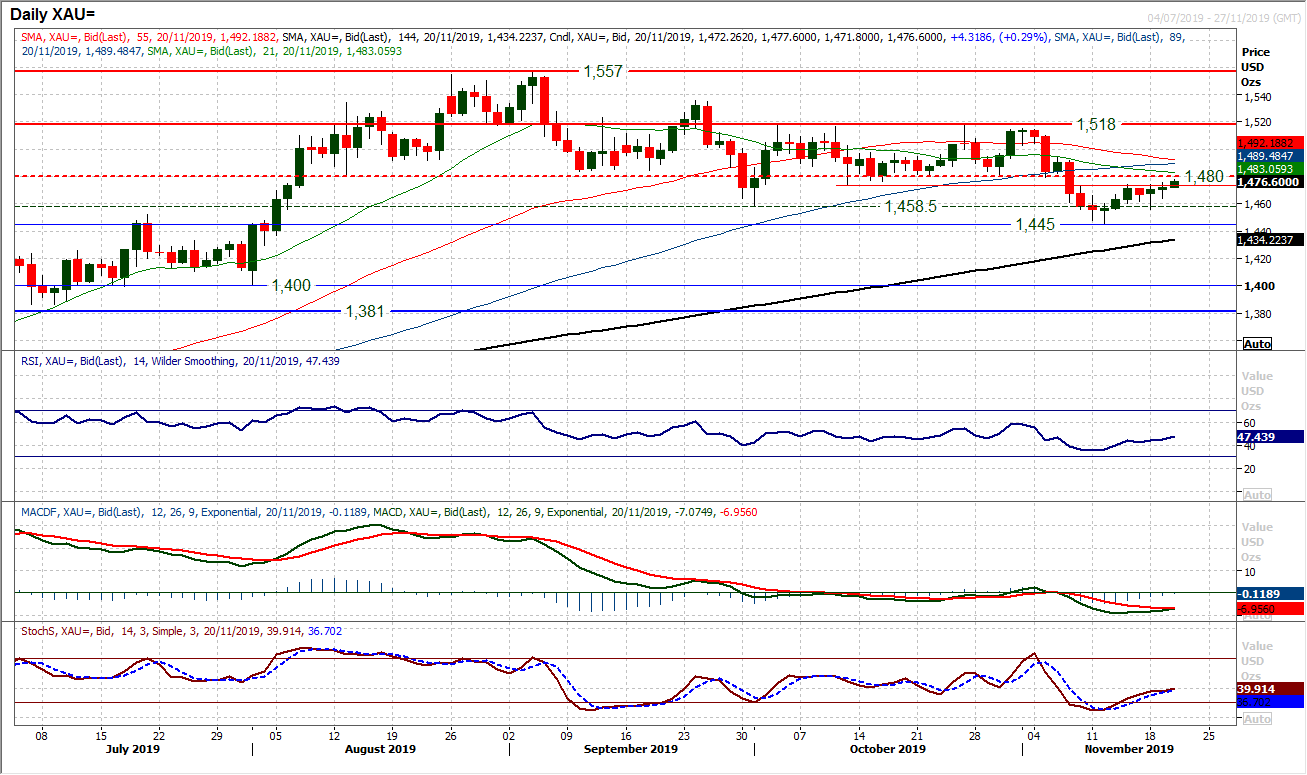
Another consolidation candle and muted gain on gold yesterday is progressing the recent rally but still at a slow pace. This is now the fourth consecutive candle closing within $5, all under the near to medium term resistance $1474/$1480. Reaction to the prospect of Trump raising tariffs again could be key (you would think this would be decisively gold positive). Initially, the move has been positive, but if there were to be continued resistance under $1480 it would be a sign that the market is wary of chasing gold higher from here. There is a mini higher low at $1456 from Monday’s low which needs to hold to prevent renewed selling momentum from building up again. We continue to sell this recent rally as counter to what is a corrective outlook on gold, predicated on the likelihood of an agreement between US/China being struck at some stage in the coming weeks. Momentum indicators still have upside potential in an unwind, as the rally continues. However, overhead supply is now coming into play and an opportunity could be ahead.
WTI Oil
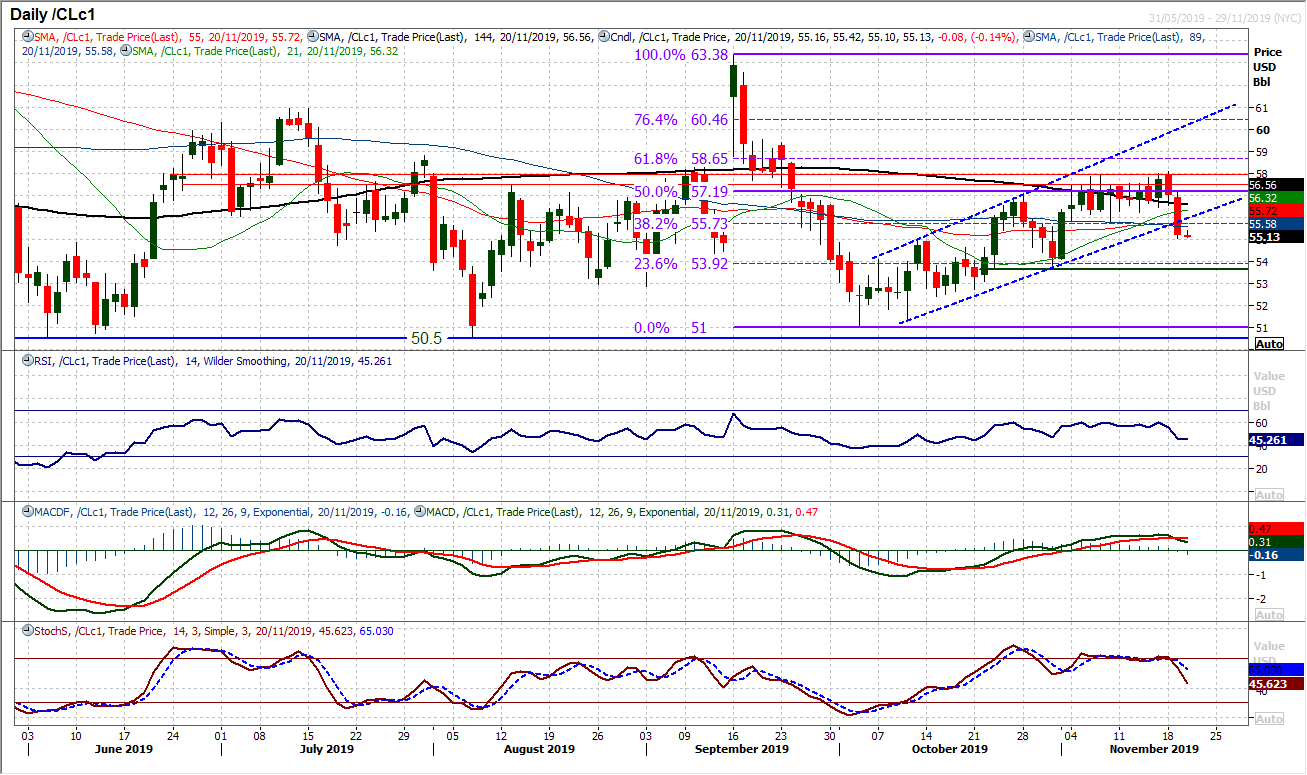
Has the outlook on oil changed again? A suggestion that Russia would not agree to further OPEC production cuts has driven the price of oil lower. A second decisive negative candle has not only broken the uptrend channel of the past five weeks, but also the support at $55.75. It comes also with sell signals on momentum, with a MACD bear cross and Stochastics also crossing lower. The reaction today will be key. If the old support band $55.75/$56.20 now becomes a basis of resistance, then this could quickly turn into a sustaining move to test the support of the key higher low at $53.70. The RSI moving below 40 would also be a corrective signal.
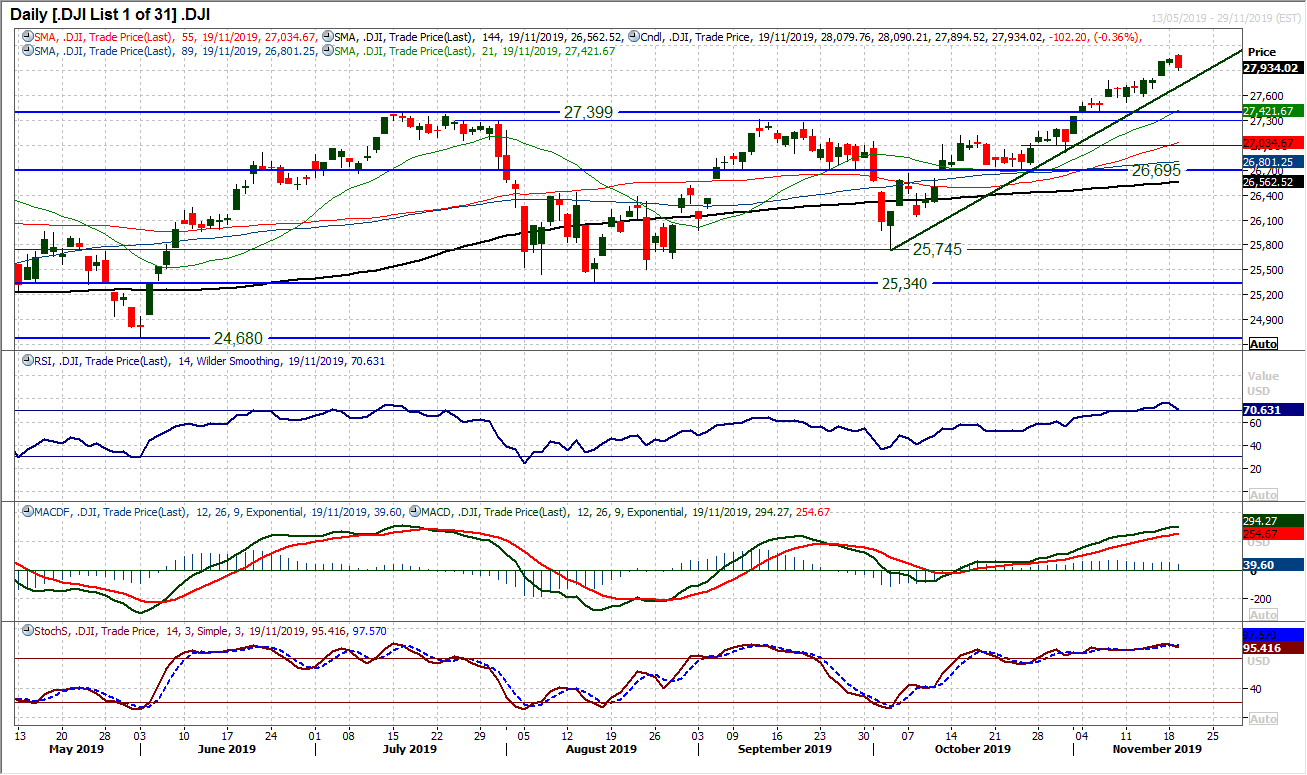
After the first really negative candlestick on the Dow for more than a few weeks, market reaction will be key. Yesterday’s bearish engulfing candle (bear key one day reversal) is an exhaustion candle. We discussed previously that the trend higher (which comes in at 27,765 today) was pretty relentless, however there has not been two consecutive negative closes in around six weeks. That makes the reaction today important, as a second negative candle today could suggest a corrective phase starting to develop. Previous closes lower have been met with near immediate buying pressure again. We noted yesterday that the initial support was 27,775/27,800. Momentum has slipped mildly (RSI back towards 70) but no sell signals yet. Resistance is now key at yesterday’s high of 28,090. We are still buyers into support within the uptrend, however, we were cautious bulls yesterday and even more so today.
DISCLAIMER: This report does not constitute personal investment advice, nor does it take into account the individual financial circumstances or objectives of the clients who receive it. All information and research produced by Hantec Markets is intended to be general in nature; it does not constitute a recommendation or offer for the purchase or sale of any financial instrument, nor should it be construed as such.
All of the views or suggestions within this report are those solely and exclusively of the author, and accurately reflect his personal views about any and all of the subject instruments and are presented to the best of the author’s knowledge. Any person relying on this report to undertake trading does so entirely at his/her own risk and Hantec Markets does not accept any liability.
