- As investors, we must glean crucial information about the companies on our radar when repositioning our portfolios.
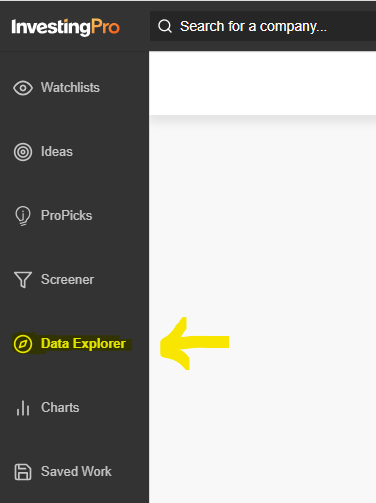
- InvestingPro's 'Data Explorer' allows you to search for all the data you need among hundreds of possible metrics.
- Be it the solvency ratio, basic EPS growth, Piotroski score, or return on assets, you can discover all the value-added information about companies in one place.
- Find out which stocks are trading at a discount this Black Friday with our exclusive InvestingPro offer.
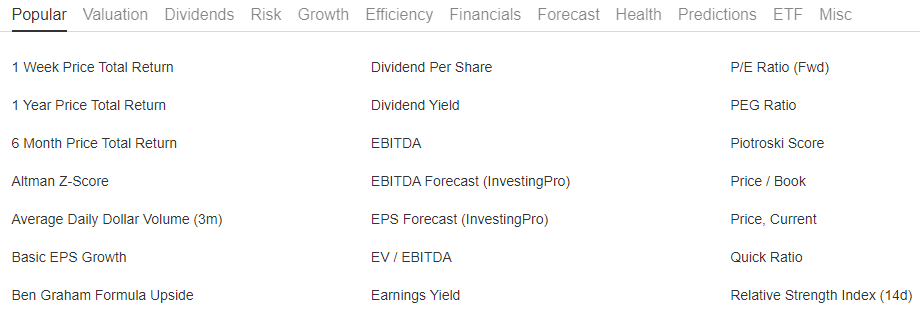
- 1-week total price return: total price change (adjusted for dividends and splits where applicable) over the last 1 week.
- 1-year total price return: Total price change (adjusted for dividends and splits where applicable) over the last 1 year.
- 6-month total price return: Total price change (adjusted for dividends and splits where applicable) over the last 6 months.
- Altman Z-Score: Formula used to predict the probability of a company going out of business within 2 years.
- Average daily dollar volume (3m): Three-month average of shares traded each day multiplied by the share price.
- Basic EPS growth: Growth in basic EPS for a quarter versus the previous quarter.
- Ben Graham Formula Increment: Percentage upside (if positive) or downside (if negative) an investor can expect relative to the current stock price based on the Ben Graham formula value. The Ben Graham formula value estimates the intrinsic value of a stock based on a formula inspired by investor and professor Benjamin Graham.
- Age of quoted price: Indicates the length of time since the last quote. The value is one of the following: delayed, real-time, end-of-day, or unavailable.
- EV/EBITDA ratio: Technique used to measure the level of EBITDA growth in relation to the EV/EBITDA multiple.
- Share turnover ratio: This item represents the three-month average volume divided by a company's outstanding shares.
- 7 Steps to Filter Out Market Noise and Maximize Your Profits
- How to Filter the Market for the Best Stocks to Buy Today
In the dynamic world of markets, access to the best information is paramount for informed investment decisions.
InvestingPro, the professional tool from Investing.com, provides a diverse range of value-added information crucial for effectively managing our portfolios.
Among the options offered by InvestingPro, the 'Data Explorer' section stands out, which displays financial information on companies according to a wide variety of metrics.

Source: InvestingPro
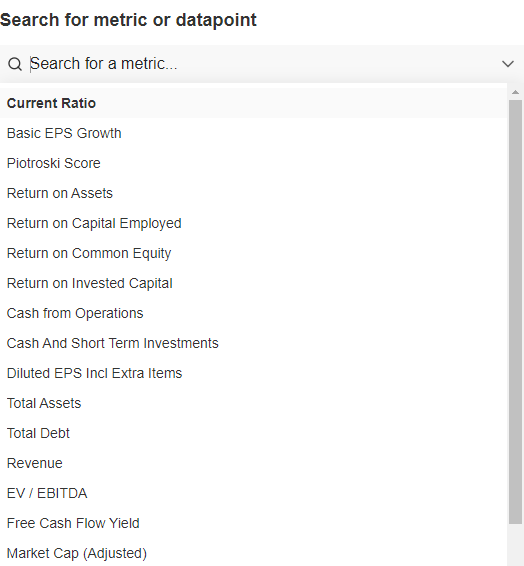
It offers a search engine with several options. These include solvency ratio, basic EPS (earnings per share) growth, Piotroski score, return on assets, return on capital employed, return on common equity, revenue, etc.

Source: InvestingPro
The data explorer also offers information according to the options that may be most useful to the investor: Most Popular, Valuation, Dividend, Risk, Growth, Efficiency, Fundamental, Forecast, Status, Predictions, or ETF, among others.

Source: InvestingPro
In each category, InvestingPro offers metrics sorted in alphabetical order.
The 'most popular' financial metrics are:

Source: InvestingPro
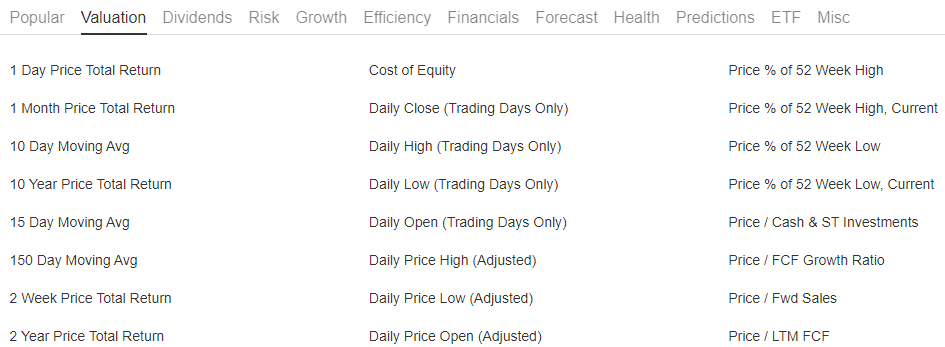
Under the 'Valuation' tab, you can find more than 170 metrics. Among them, the following stand out:

Source: InvestingPro
In this analysis, we have discussed all the metrics available in 2 tabs, but there are still 10 other tabs that offer comprehensive information about the stock in question.
In a volatile market where strategic decisions can significantly impact our portfolio, possessing the most accurate market information becomes indispensable.
Utilizing InvestingPro's data explorer ensures direct access to market data that can enhance your portfolio's performance.
Read also:
***
Buy or Sell? Get the answer with InvestingPro for Half of the Price This Black Friday!
Timely insights and informed decisions are the keys to maximizing profit potential. This Black Friday, make the smartest investment decision in the market and save up to 55% on InvestingPro subscription plans.
Whether you're a seasoned trader or just starting your investment journey, this offer is designed to equip you with the wisdom needed for more intelligent and profitable trading.
Disclaimer: This article is written for informational purposes only; it does not constitute a solicitation, offer, advice or recommendation to invest as such and is in no way intended to encourage the purchase of assets. I would like to remind you that any asset class is evaluated from multiple points of view and is highly risky. Therefore, any investment decision and the associated risk remains with the investor.

