Market Overview
The drone attacks on oil fields in Saudi Arabia has caused a dramatic shift in market risk appetite once more. With oil prices soaring almost 15% in one day, it has the potential to cause a significant wobble to an already fragile rebound in sentiment. Traders reacted yesterday back into safe haven plays. Treasury yields back lower, gold and the yen supported, whilst the US dollar has also found its feet again. The question is how sustainable this move will be. Newsflow on the Saudi and US response will be key. Iran tend to read from the same playbook as Russia, and as such plausible deniability is standard. Is this acceptable to President Trump? Treasury yields will tend to be a strong gauge. Sharp rises to the oil price have two negative economic shocks, to pull inflation higher and to hit growth. It seems that with the US 10 year yield falling by -6 basis points, growth is the main fear. If yields continue to fall back, then safe havens could continue to be favoured and in this case, the dollar seems to be rising to the top. The initial moves are looking to stabilised to an extent this morning, but any continued weakness in yields would really play into the fears of traders. Big geopolitical shocks will often be over-reacted and for now, looking across several markets, there has been no significant trend changing moves (aside from oil). Whether this shift out of riskier assets (equities lower, Aussie and Kiwi under pressure) gains traction to scupper recent recoveries, will be seen in the coming days.
Wall Street closed -0.3% lower at 2998 last night, whilst US futures are a further -0.2% back in early moves today. Asian markets have been mixed to weaker with the Nikkei almost dead flat, whilst the Shanghai Composite was -1.5%. European markets are back under pressure as FTSE futures show -0.4% and DAX futures -0.2% in early moves. In forex, there is a continuation of the risk averse outlook, with AUD and NZD under pressure, whilst USD continues to be the main outperformer across the major pairs. In commodities, the stronger dollar is acting as a drag on gold and silver this morning which are paring some of yesterday’s gains. The oil price had threatened to unwind earlier in the Asian session, but is now only around half a percent lower, in spite of yesterday’s huge gains.
There is an industrial focus to the economic calendar today. With a concerning deterioration in German industrial numbers recently, the German ZEW Economic Sentiment at 1000BST will be an important gauge on Tuesday. Economic sentiment is expected to pick up marginally to -38.0 in September (from -44.1 in August) but this would still be at multi-year lows. Furthermore, the ZEW Current Conditions component is expected to continue to deteriorate to -15.5 which would be the worst reading since May 2010. Moving into the US session, the US Industrial Production at 1415BST which are expected to grow by +0.2% in the month of August (after a decline of -0.2% in July). The capacity utilization is expected to improve slightly to 77.6% (from 77.5 in July). The NAHB Housing Market Index at 1500BST is expected to remain at 66 in September (66 in August).
Chart of the Day – EUR/GBP
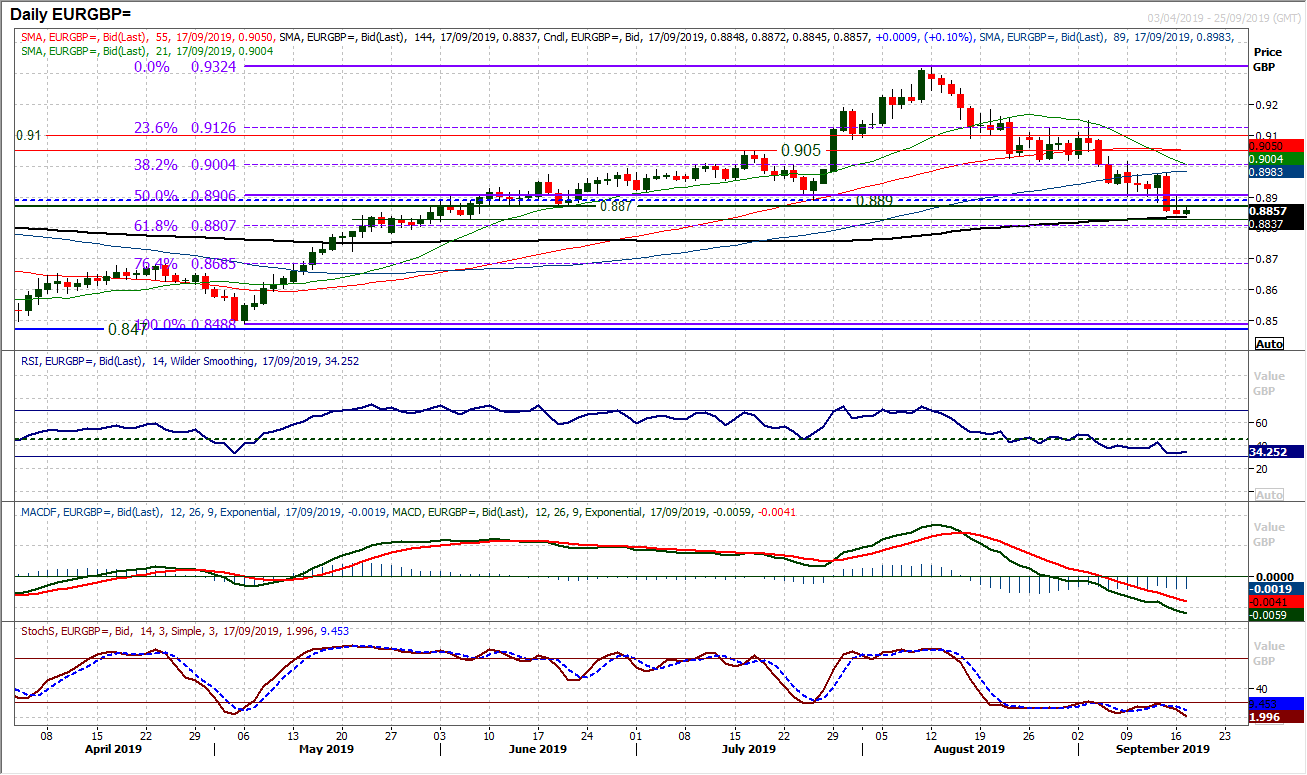
Throughout recent weeks as sterling has strengthened on reduced “no deal” Brexit risk, there have been several bouts of consolidation in the outperformance against the euro, but continues to be sold into. Friday’s decisive bear candle has once more re-engaged the selling pressure, but also now broken below the key support band £0.8870/£0.8890 which were the old June/July lows. It leaves behind another lower high at £0.8975. Furthermore, moving clear of the 50% Fibonacci retracement of the £0.8490/£0.9375 (at £0.8905) means the 61.8% Fib level around £0.8805 is the next target area. Momentum indicators remain deeply negatively configured with the RSI into the low 30s, along with continually negatively configured Stochastics. We are still looking to use rallies as a chance to sell. There is resistance initially now £0.8870/£0.8905 which is now a “sell zone”.
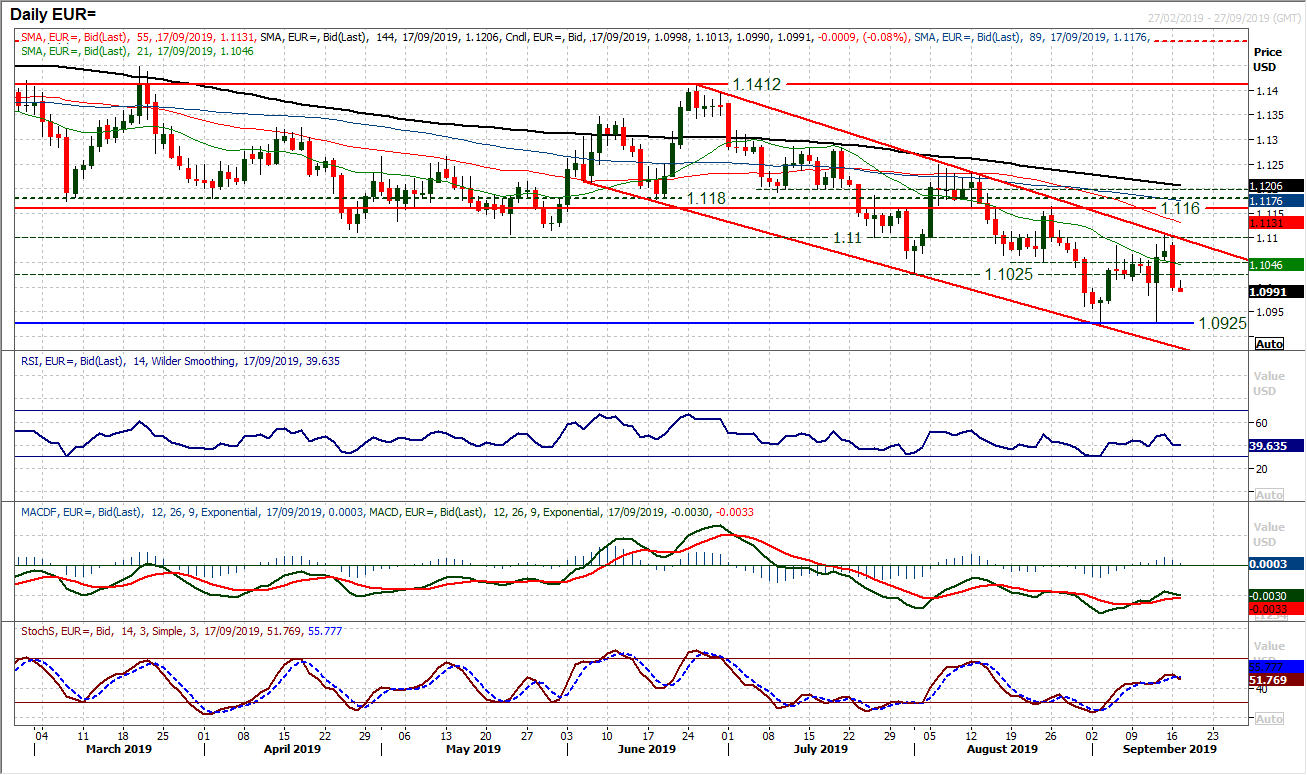
A huge bear candle yesterday has re-emphasised the downtrend channel once more. A loss of almost 75 pips on the day has left in place key resistance at $1.1110 and adds to the ceiling in place around the $1.1100 big figure area. However, equally it is clear that markets were reacting with high volatility yesterday and once the dust settles we will know more about realistic positioning. Looking past the volatility of recent sessions (ECB included), essentially the outlook for EUR/USD has continued to be very choppy and lacking conviction. Momentum indicators retain their broadly negative configuration on a medium term basis, whilst playing out the downtrend channel. How the market settles after this period could be telling. There has been a pick up from $1.1000 this morning, but if the market once more starts to trade with a $1.09 handle then the $1.0925 support could come under more pressure. Just to add to the lack of conviction in the next session or so, tomorrow’s crucial Fed meeting is looming. Initial picot resistance $1.1050.
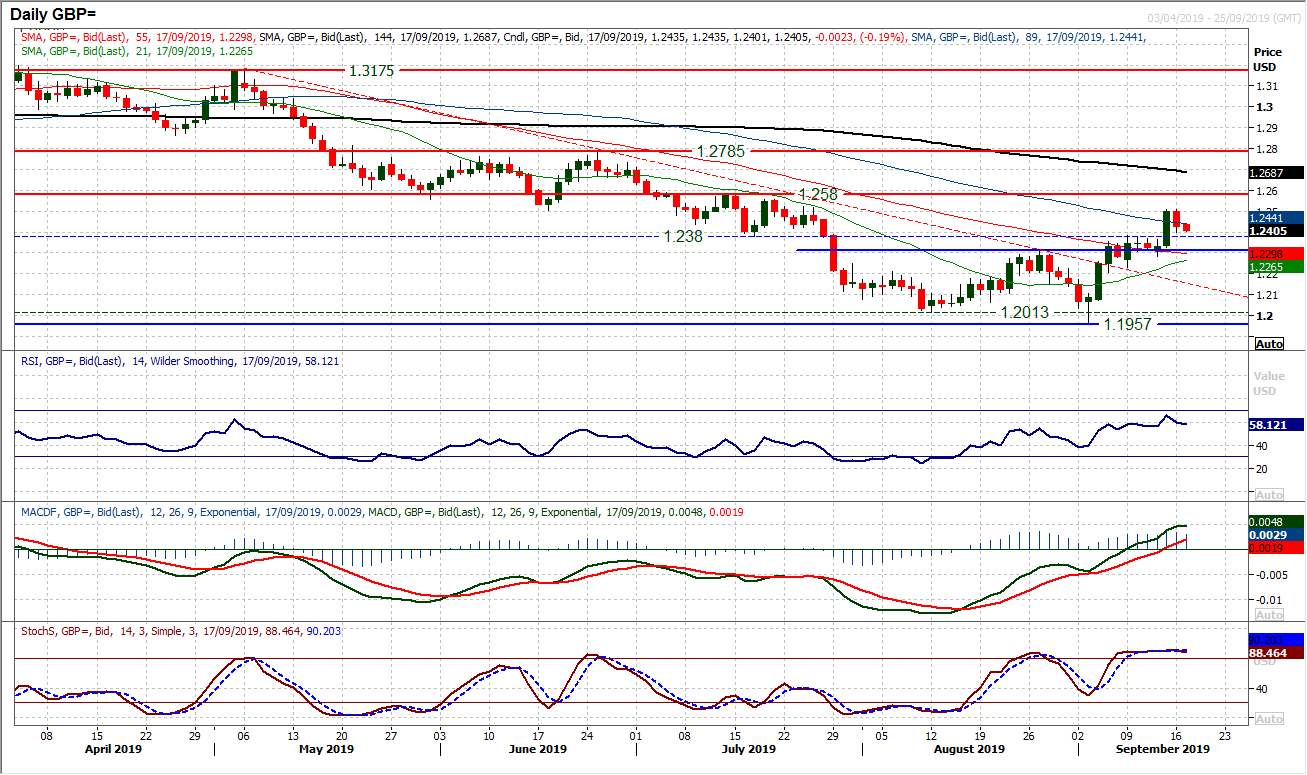
The strength of the bulls is being tested. Able was not the only major pair to slip amidst renewed dollar strength yesterday, but the bulls will be keen to get quickly back on track. The recent key breakout above $1.2380 is now a pivot of support the bulls will be looking to hold on to. Momentum remains strong with the recovery, with the MACD lines rising decisively above neutral now, Stochastics still positively configured and RSI still around four month highs. Resistance is now in place at $1.2510 but the bulls will see this as an opportunity to buy once more as the recovery remains on track. Below $1.2380 (on a closing basis) would question this position, whilst the higher low at $1.2280 is increasingly important now.
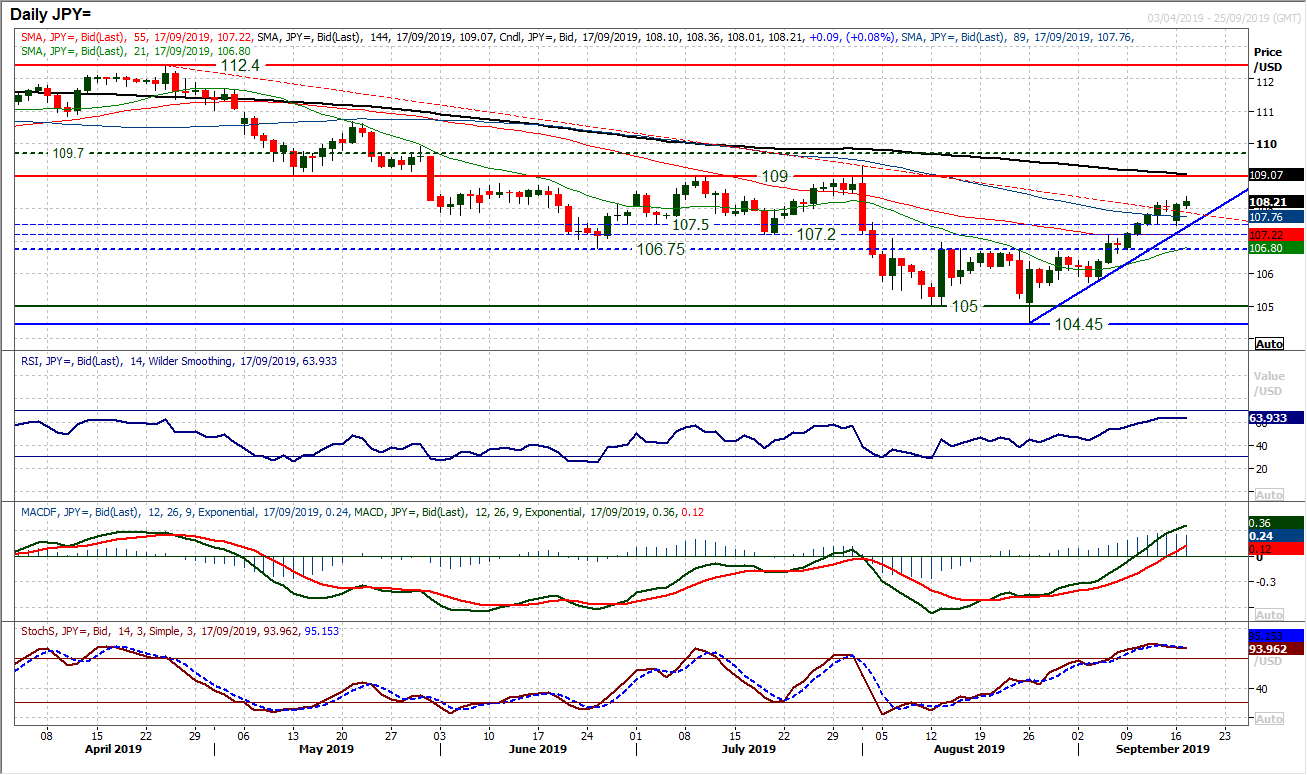
The momentum of the recovery has been questioned in the past couple of sessions. However, with the positive daily candlestick and uptrend intact, we continue to see corrections into support are a chance to buy. Having broken out above 106.75/107.50 this pivot band is a basis of support. This breakout has now been tested on a couple of occasions (last Thursday and Monday) and is holding. The support of a three week uptrend is up at 107.45 today. Momentum remains strongly configured, even though there has been a slight stalling. This comes with the RSI holding in the 60s (5 month highs), whilst MACD lines are rising above neutral. Stochastics are above 80, although there is a caveat where a bear cross needs to be watched now. However, holding above the supports and the lack of corrective candlesticks will give the bulls continued confidence. Resistance at 108.25 has already been breached as the bulls have reasserted themselves this morning, and gains towards the 109.00 key resistance should be seen in due course.
Gold
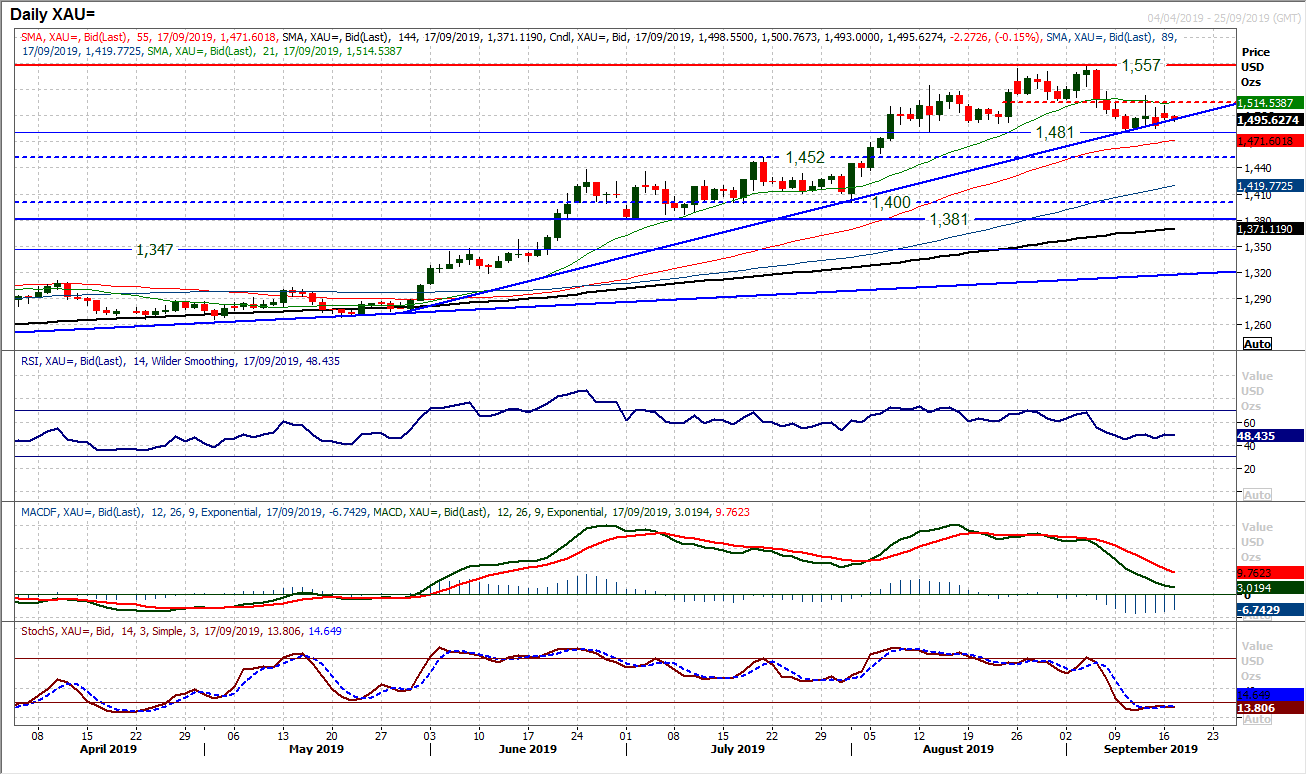
We noted recently the market moving into more of a consolidation phase. This is still the case as support continues to build above the $1481 key low. This is helped now as the long four month uptrend is still broadly intact (after briefly being breached on Friday) to maintain the positive outlook around $1496 today. However, there have now been just one positive candle in the past eight sessions, even if the market has picked up off the lows. The key for the bulls to really gain traction would be a close above $1517 which has become a pivot. The bull will be aware that the 21 day moving average (currently c. $1515) which has previously been supportive is threatening to become a consistent basis of resistance. There has been a slight stalling of the corrective momentum in recent sessions, but the bulls are still yet to return with any conviction. This remains a market in limbo between $1481/$1517. Initial support at $1495 above the $1481/$1485 growing band of support. We would begin to concern for a big top pattern if the uptrend were to begin being breached on a consistent basis.
WTI Oil
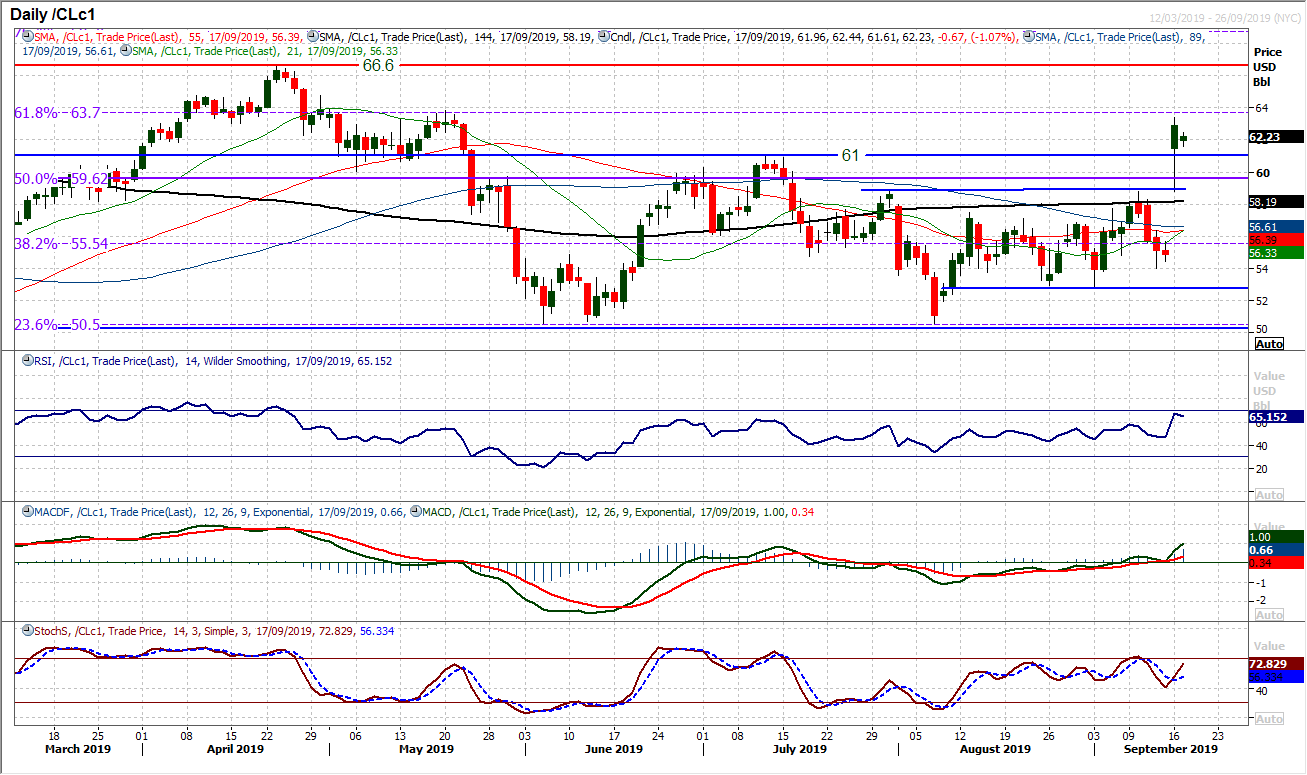
When such a significant fundamental event hits a market, it is difficult to give any technical appraisal that can add much. Aside from talking about volatility, the huge breakout above $61.00 is bullish. However, given that markets tend to over-react to such events, a degree f unwinding is still likely to be seen. Furthermore, it will be newsflow (such as the prospect of escalated tensions turning into military conflict in the region) that will move the oil market. The usual course of events, would be, lacking any further escalation, for the market to unwind in the coming days. It was interesting to see yesterday’s intraday spikes finding support at the breakout around $58.80. This leaves a band of support $58.80/$61.00 for the bulls to work with. Initial support this morning is at $61.45.
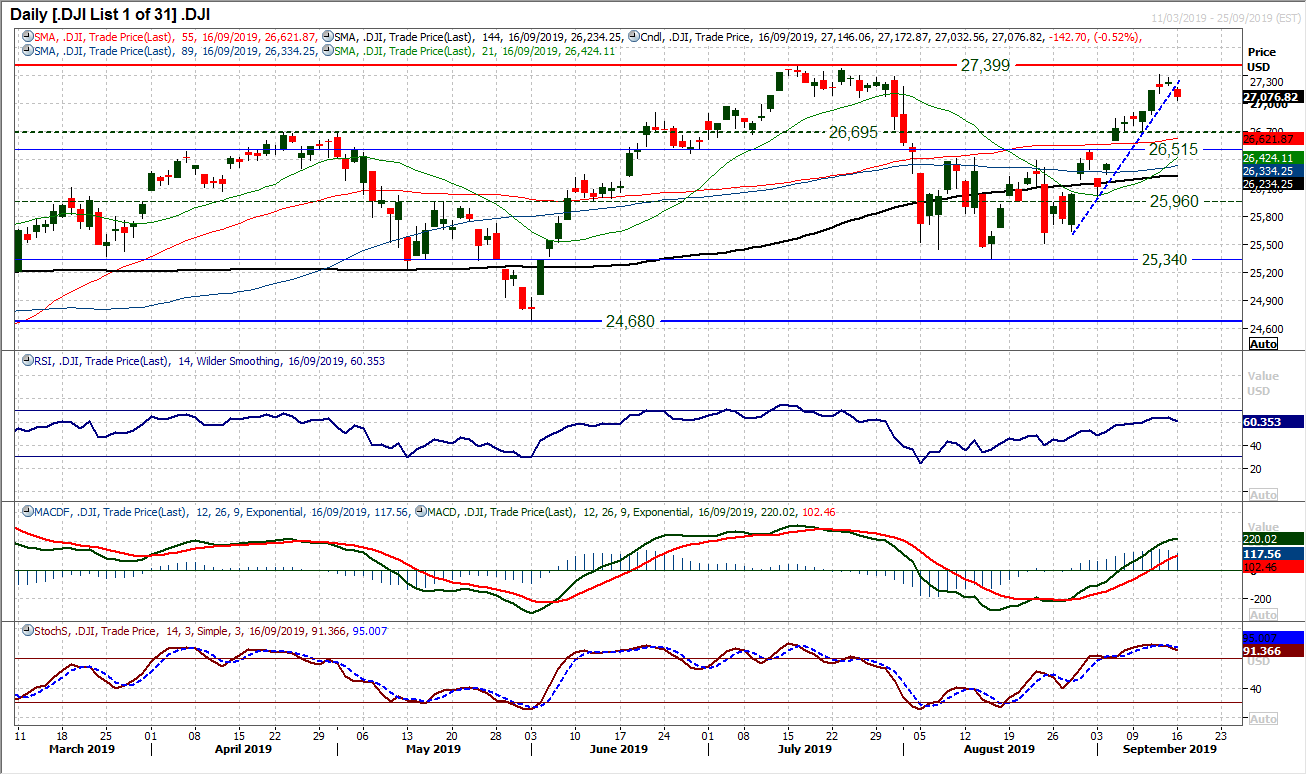
With the ratcheting up of geo-political tensions in the Middle East following the drone attack on Saudi oil fields, reduced risk appetite has hit the Dow. The run higher had been using the support of a two and a half week uptrend, but yesterday’s close lower with a negative candlestick has broken this run. Losing half a percent on the day, the lowest close in four sessions has questioned the sustainability of the bulls. The immediate implication could be for a near term slip lower. However, does this do sustainable damage to the recovery? Having broken out, a neckline band of support 26,515/26,695 has been left and will be seen as a watershed now. Momentum has become increasingly positive in recent sessions, with RSI into the 60s, Stochastics above 80 and MACD above neutral. If the bulls can hold up above initial support at 26,900 and maintain some sense of positive configuration (RSI above 50, Stochastics preventing a confirmed bear cross sell signal) then the bulls can hold their ground to use weakness as a chance to buy. Initial resistance is with a gap at 27,195 and then the recent high of 27,307.
"""DISCLAIMER: This report does not constitute personal investment advice, nor does it take into account the individual financial circumstances or objectives of the clients who receive it. All information and research produced by Hantec Markets is intended to be general in nature; it does not constitute a recommendation or offer for the purchase or sale of any financial instrument, nor should it be construed as such.
All of the views or suggestions within this report are those solely and exclusively of the author, and accurately reflect his personal views about any and all of the subject instruments and are presented to the best of the author’s knowledge. Any person relying on this report to undertake trading does so entirely at his/her own risk and Hantec Markets does not accept any liability. """
