Goldman Sachs reinstates Smiths Group at Buy, sees 17% upside on portfolio revamp

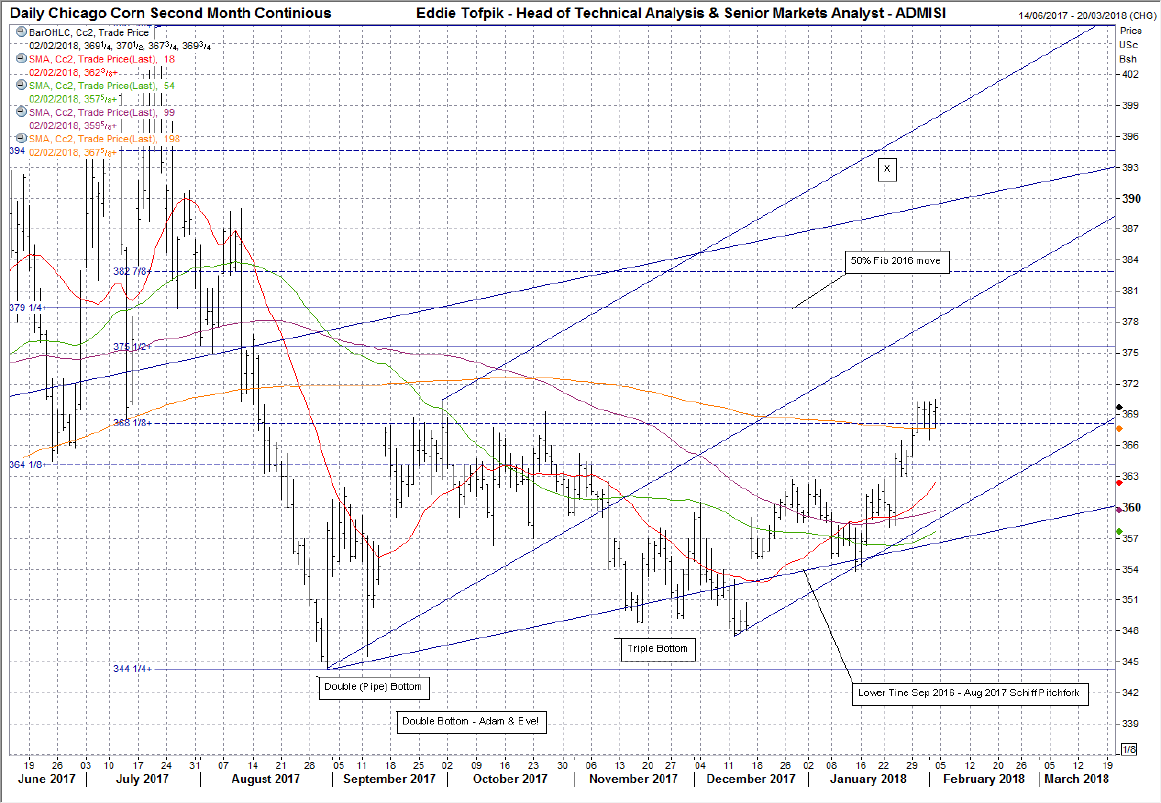
An interesting Chart Pattern above. To set the stage, back in Sep 2017 we had a Double Bottom - Horn Bottom to perhaps be more accurate. We duly rose the target and then started coming off & going sideways. We then formed a more 'rounded' Triple Bottom going into the end of the year. Since then we've started to form a Bullish move up based upon the Lower Tine of the Aug - Dec 2017 Schiff Pitchfork (currently 358). This has moved all the MAs up with the exception of the Long MA (367) which is starting to do so but which interestingly the market has already moved above and actually this week seemingly form a base for a potential try higher. This base around 368 is actually the breaking level for a larger Pattern - the Double Bottom- Adam & Eve! This Pattern is similar to any other DB but the first portion - the 'Adam' - has characteristics of a spike down... in this case a twin spike Horn Bottom down back in Aug - Sep 2017.
The second portion is the 'Eve' which is a more Rounded Bottom...or in this case you can look at the Nov - Dec 2017 Triple Bottom as the 'rounded' part. So what next? Well, typically you would look for a doubling up of the Adam portion from a break upwards of the top of the Pattern once the Eve portion had been developed...or over 368...! So far we haven't seen the break upwards but would suggest looking out for it. The doubling up would mean a potential target of about 393 area. Should this happen then you'd need to look out for the 'Handle' Pattern that sometimes follows...but there's plenty of time ahead of that. Ahead is the big...very big... key 50% Fib of the July - Aug 2017 move at 375 and the longer term 50% Fib of the whole of 2016 at 379.
We have a way to go if that happens but it is worth pointing out the obstacles early. If we turn around back down then consecutive closes under the Lower Tine of the Aug - Dec 2017 Schiff Pitchfork would fail the move up. With this in mind and with all but one MA pointing upwards I'll move the bullet point above into mildly Bullish for the moment. Support is currently at 368 - 367(dynamic), 366, 364, 363, 358(dynamic), 356(dynamic), 353 & 350. Resistance is currently at 370, 375, 376, 378(dynamic), 379 & 382.
"Disclaimer:ADM Investor Services International Limited is authorised and regulated by The Financial Conduct Authority. Member of The London Stock Exchange. Registered office: 4th Floor Millennium Bridge House, 2 Lambeth Hill, London EC4V 3TT. Registered in England No. 2547805 a subsidiary of Archer Daniels Midland Company. Risk Warning: Investments in Equities, CFDs, Futures, Options, Derivatives and Foreign Exchange can fluctuate in value, investors should therefore be aware that they may not realise the initial amount invested, and indeed may incur additional liabilities.
These Investments may entail above average financial risk of loss, and investors should therefore carefully consider whether their financial circumstances and investment experience permit them to invest and, if necessary, seek the advice of an independent Financial Advisor. Some services described are not available to certain customers due to regulatory constraints either in the United Kingdom or elsewhere. © 2014 ADM Investor Services International Limited 2014.