Copper prices are hinting at revisiting, by next year, the mid-$4 per lb record highs set in 2011—a remarkable turnaround for long-only investors who have seen little joy from the metal for the better part of the last decade.
The optimism of a full global recovery from the coronavirus pandemic by 2021, as COVID-19 vaccines enter the final stage of delivery to the market, is fueling hyper bullish forecasts for natural resources, securities and assets of all kind. Copper, as the No. 1 indicator of the economy, has not been spared.
Dubbed 'Dr. Copper' by some of the greatest economists during an era when the metal’s prices were in lockstep with the global economy, the red metal has, in recent years, been increasingly out of touch with world growth.
Last year, after what seemed like an eternity of woeful performance, long-only investors made 6% on copper, and that followed a particularly agonizing 19% loss in 2018.
2020 Renaissance Year For Metals, Despite Pandemic
For many analysts, this year, which marked the start of a new decade, had been earmarked as the renaissance period, not just for copper but for all industrial metals. No one knew then that it was also going to be the year of a global pandemic. Even so, 2020 has ended up fulfilling the prophecy of the bullish calls on metals, fueled by optimism over the early recovery of giant copper consumer, China from the pandemic.
And copper, used in everything from micro-circuity of cellphones to giant turbines that channel significant megawatts of power, looks set to continue the upward charge into 2021. This year so far the red metal is up 23%, after logging losses in just three of the past 11 months.
China Driving Wild Buying Across Metals, Particularly Copper
Brokerage TD Securities remarked in a note on Tuesday that Beijing’s voracious consumption of most metals to make up for lost growth opportunities in 2020 and in an attempt to leapfrog into 2021 was having a major impact on copper prices:
“As China's insatiable appetite fueled a second wave of stockpiling which fueled a powerful rally in the red metal, the data suggest that the (hedge) funds have now entirely covered their short. This short covering likely contributed to the strength in … prices, which enabled the wave of stockpiling to take place.”
But the brokerage, known for the world-class metals research of its Canadian parent TD Bank, said its real-time commodity demand indicator was also showing the first signs of stalling after a rally in almost all natural resources on expectations that COVID-19 vaccines would be available soon:
“This begs the question—how much longer can China keep stockpiling metals before it loses its appetite?”
While commodity fundamentals are a matter of highly subjective supply-demand cycles, the other best indicator of where copper may be headed in the coming months will be based on its recent chart action.
2021 Expected To Be Record High Year For Copper
 All Charts Courtesy of SK Dixit Charting
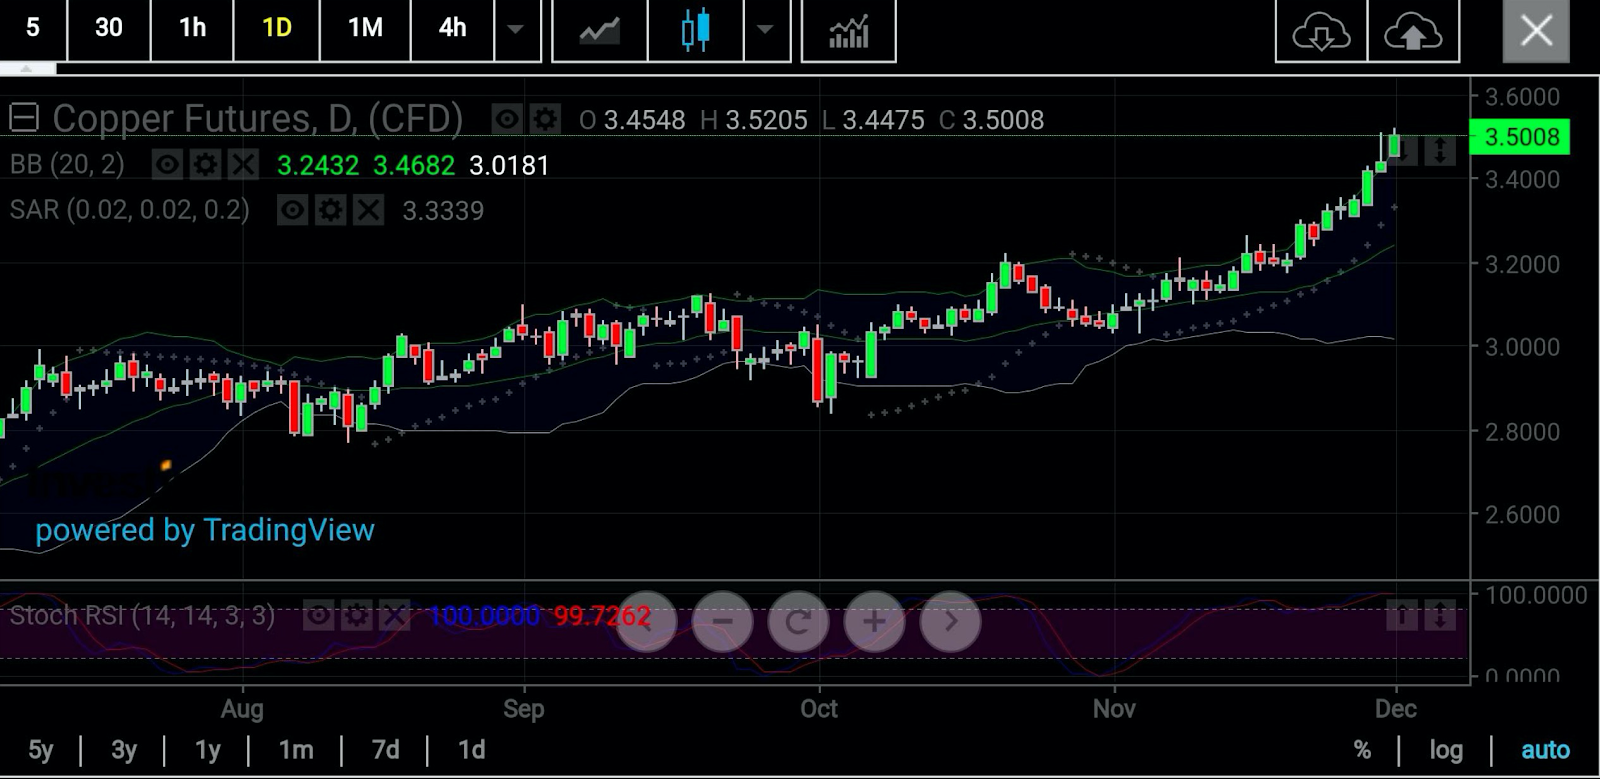
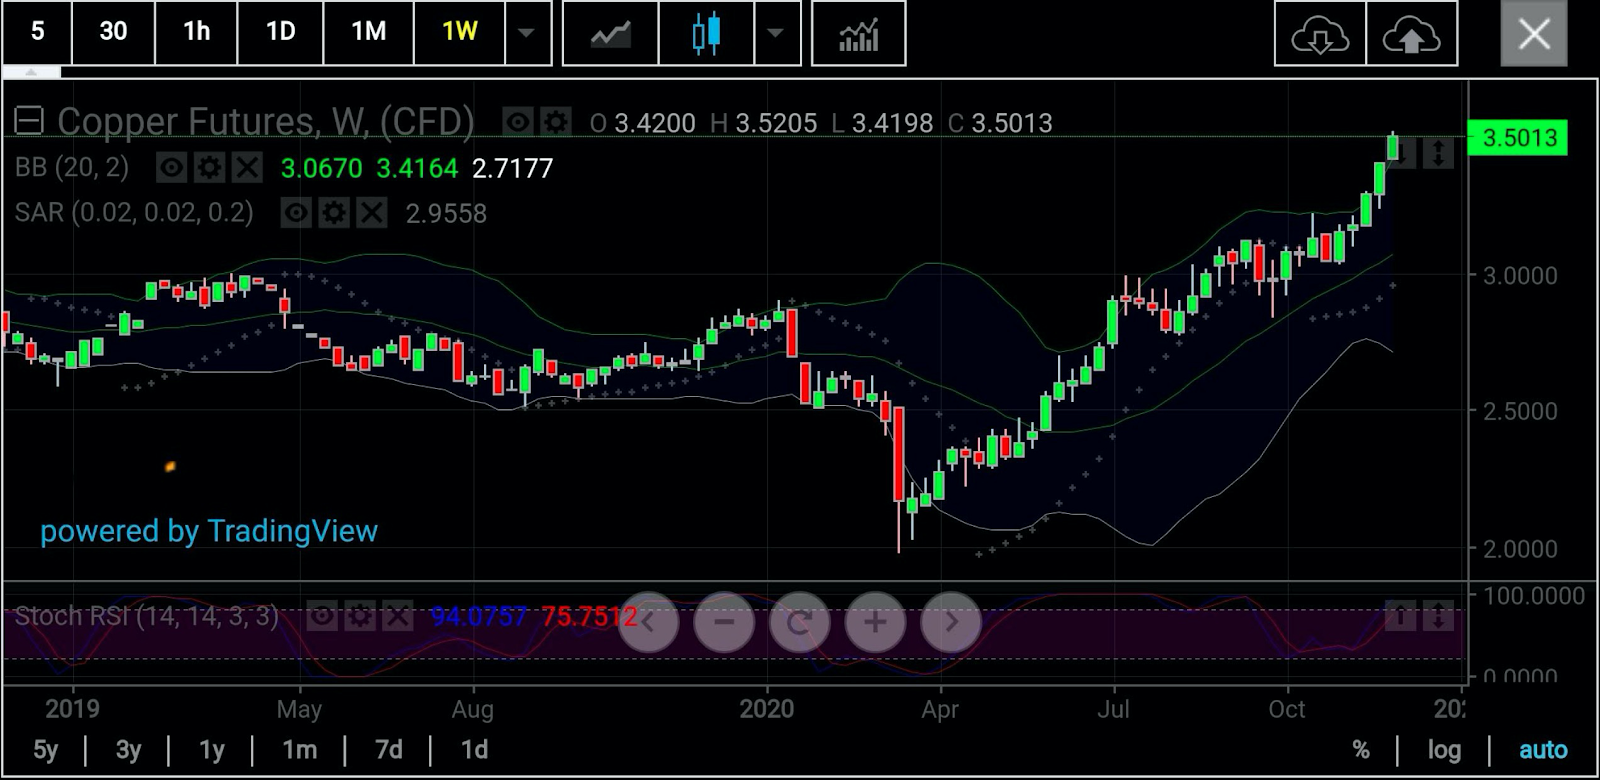
In that direction, metals chartist Sunil Kumar Dixit of SK Dixit Charting in Kolkata, India, sees copper, now at seven-year highs of around $3.52 per lb on New York’s COMEX, hitting $4.60 pricing last seen in February 2011:
“Copper proved a bullish breakout in line with our previous analysis of strength above $3.20-$3.30 leading to range break for posting multi year highs.”
“Going forward, a sustained and decisive move above $3.50 strengthens the case for copper testing $4.20-$4.30 highs seen during 2006-2008 and retesting record of $4.60 in 2011. However the continuation of this bull run requires the metal holding above $3.40 and most importantly the hard floor $3.00.”
Dixit added that a deeper study of copper’s monthly chart showed the metal heading up in tandem with the bullish 'W' formation after breaking $3.30.
“This formation has a height of $1.20-$1.40, which gives upside targets for $4.30-$4.60.”
 On Investing.com’s end, while our base case for copper shows support unbroken at $3 for now, any disruptions in the economic narrative before the end of 2020 and beyond could change that.
Our Daily Technical Indicator has a “Strong Buy” on COMEX copper, with resistance pegged first at $3.522, then $3.559 and beyond that at $3.5965.
Support begins at $3.448, then moves to $3.410, before digging in at $3.373.
As with all projections, I urge you to follow the charts but temper them with fundamentals—and moderation—whenever possible.
Disclaimer: Barani Krishnan uses a range of views outside his own to bring diversity to his analysis of any market. He does not own or hold a position in the commodities or securities he writes about.
