Oil bulls will be fighting to keep the rally in crude alive this week as prices retreat from 2014 highs and risk falling further on reports of possible US waivers on sanctions against Iranian exports. Traders also await key supply-demand reports from the world’s top energy agencies that might further dilute the bullish narrative on oil.
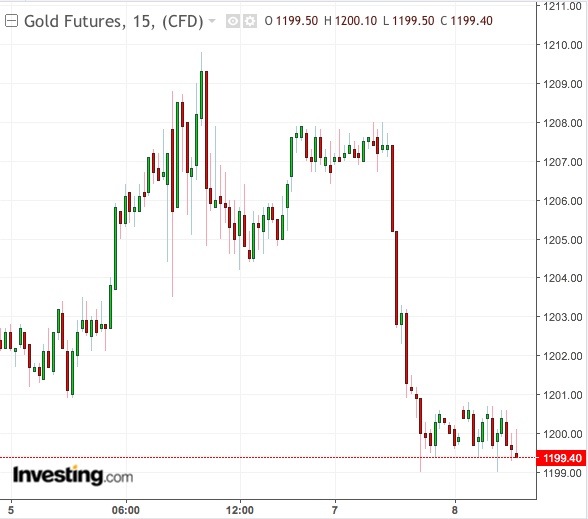
On the precious metals front, investors will have to decide on whether to defend gold at above $1,200 an ounce as the dollar shows signs of a breakout on persistently hawkish Federal Reserve language and soaring 10-year Treasury yields.
In base metals, copper could stage a rebound after selling emerged last week at the $2.83-per lb resistance, despite analysts’ views that futures of the infrastructure material were undervalued.

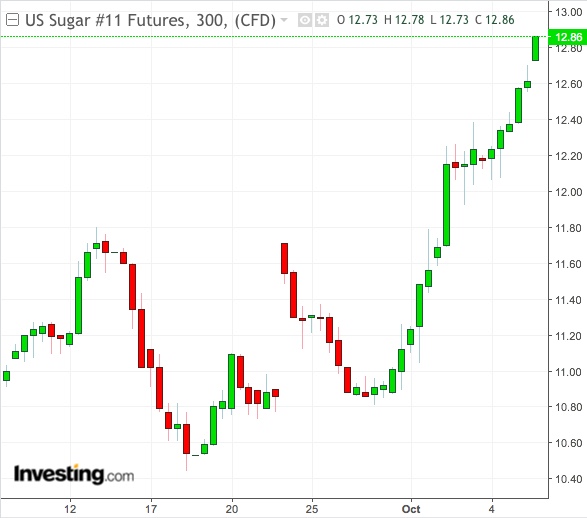
Opportunity for profit-taking, meanwhile, looms in sugar after last week’s eye-popping gain of 21% that landed the sweetener in overbought territory.
Natural gas is another market that could be targeted by bears after a large increase in weekly inventories that might complicate efforts to keep prices above $3 per million metric British thermal units.
Market specifics aside, key economic and energy data could provide traders with direction. These include China's PMI and trade balance and US PPI, CPI and Michigan Consumer Sentiment.
US Dithering On Iran Leaves Oil Vulnerable To Profit Taking
Oil began the week lower in Asia after a US official said Friday that Washington might consider granting waivers on sanctions against Iran’s oil exports due to start on November 4. Exemptions would be for countries that had shown effort to reduce imports from Tehran, the official said.
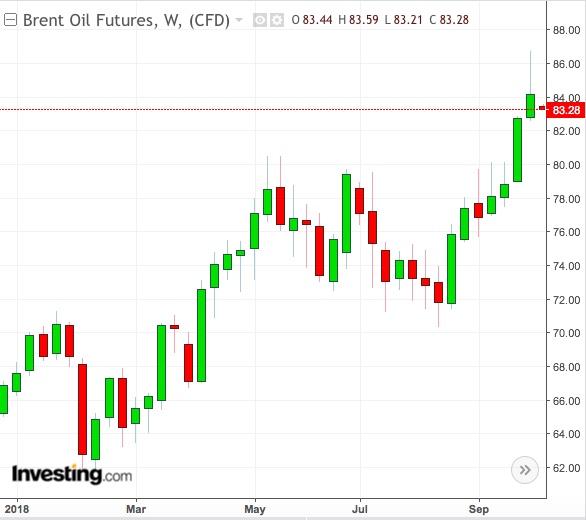
Crude prices notched a fourth-straight weekly gain last week in their longest winning streak since May on fear that major oil producers Russia and Saudi Arabia will have little spare capacity to offset a global supply crunch anticipated from the Iranian sanctions. Iran produced a peak of 2.7 million barrels per day in May, and could be prevented from shipping up to 1.5 million barrels per day (bpd) Goldman Sachs said Friday.
London-traded Brent was down 1% by 1:05 AM ET (4:05 GMT) on Monday, ahead of the open of New York markets. US West Texas Intermediate (WTI) crude fell 0.7%.
“I view the market as ahead of itself and in the overbought area and susceptible to a round of profit taking selling at any time … although still in an uptrend,” said Dominick Chirichella, director of risk management and trading at the Energy Management Institute in New York.

Brent and WTI have risen 23% on the average for 2018. The UK benchmark hit a Oct 2014 high of $86.74 on Oct. 3 while its US peer rose to a November 2014 peak of $75.20 on Friday. Many traders are betting Brent will cross $100 by end of the year or by early 2019.
Some, however, say the worries over Iran are mere hype, and that there will be adequate supply of crude come November, with or without sanctions. Reinforcing that notion was the largest build in US crude in 18 months recorded on the previous week—a staggering volume of 8.0 million barrels, versus analysts' expectations of 2.0 million.
Traders will also be on the lookout this week for monthly reports from the triumvirate of energy agencies comprising of the Vienna-based Organization of the Petroleum Exporting Countries (OPEC), the US Energy Information Administration (EIA) and the International Energy Agency (IEA) in Paris.
Dollar, US Bond Yields Pose Headwind For Gold
In gold, a stronger dollar and rising US government bond yields could represent a significant headwind despite Friday’s gains, as the precious metal’s inverse relationship to the greenback continues to offset safe haven demand.

New York-traded gold futures ended up 0.4% on Friday and rose 0.8% on the week at $1,206.70 an ounce, snapping two days of losses, as the dollar softened after the Labor Department reported that the rate of job creation slowed sharply in September, while wage growth also eased.
Concerns over Italy’s rising debts and strains in emerging markets will remain in focus this week, while investors will continue to monitor the effects of rising US government bond yields on markets.
Which stock should you buy in your very next trade?
With valuations skyrocketing in 2024, many investors are uneasy putting more money into stocks. Unsure where to invest next? Get access to our proven portfolios and discover high-potential opportunities.
In 2024 alone, ProPicks AI identified 2 stocks that surged over 150%, 4 additional stocks that leaped over 30%, and 3 more that climbed over 25%. That's an impressive track record.
With portfolios tailored for Dow stocks, S&P stocks, Tech stocks, and Mid Cap stocks, you can explore various wealth-building strategies.
