Get 40% Off
👀 👁 🧿 All eyes on Biogen, up +4,56% after posting earnings. Our AI picked it in March 2024.
Which stocks will surge next?
Unlock AI-picked Stocks

China still in the commodities drivers seat

Published 27/02/2024, 08:19
Updated 09/02/2024, 07:53

COMMODITIES: It’s the worst asset class (DJP) this year, like last. China’s GDP slowdown has been a key factor, alongside the strong dollar and global manufacturing recession. Near term hopes are pinned on a bigger China policy stimulus from next week’s ‘two sessions’ event. Longer term from the rise of India as the next big long-term demand driver. But the world’s fifth economy is still too small, with its $4 trillion GDP sandwiched between Japan and UK. Even as it drives specific commodities from sugar, to cotton, and wheat. It is under a quarter China’s $18 trillion GDP, that accounts for half of all demand for iron ore to copper, aluminum, and soybeans.

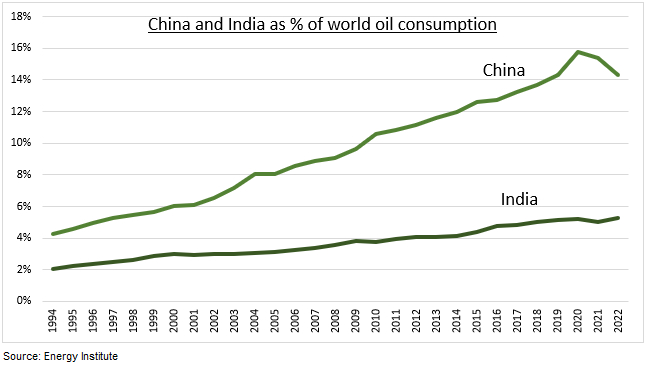
INDIA: The world’ 1.4bn most populous economy’s GDP growth has outpaced China since the pandemic. With its strong demographics, low urbanization, and policy refocus on infrastructure investment and manufacturing – which represents only 13% of the economy vs 28% in China. It has become the world’s second largest oil importer (see chart), accounting for near 5% of global production, and is dependent for 85% of its needs. Its long been one of the biggest gold buyers and is a top producer of sugar, cotton, rice, and wheat. Its export restrictions have driven global supply volatility. Commodity sector stocks make up a big 20% of the local stock market (INDA).

CHINA: The authorities have been reining in the super-sized property-sector and GDP growth is structurally slowing. The decades of 10%+ GDP growth are long gone. As it rebalances towards the consumer, to be less-carbon intensive, and as demographic headwinds build. Yet it still accounts for c.30% of global GDP growth, the most of any economy, and dominates commodity demand. Its GDP per capita of $13,000 dwarfs India’s $3,000. Whilst its commodity-heavy 40% investment/GDP level remains both higher and more state-led than India’s 30%. Yet its commodity sectors under-represented in the local market (MCHI), at under a 7% weighting.
3rd party Ad. Not an offer or recommendation by Investing.com. See disclosure here or remove ads .

China vs India oil consumption

Latest comments

Risk Disclosure: Trading in financial instruments and/or cryptocurrencies involves high risks including the risk of losing some, or all, of your investment amount, and may not be suitable for all investors. Prices of cryptocurrencies are extremely volatile and may be affected by external factors such as financial, regulatory or political events. Trading on margin increases the financial risks.
Before deciding to trade in financial instrument or cryptocurrencies you should be fully informed of the risks and costs associated with trading the financial markets, carefully consider your investment objectives, level of experience, and risk appetite, and seek professional advice where needed.
Fusion Media would like to remind you that the data contained in this website is not necessarily real-time nor accurate. The data and prices on the website are not necessarily provided by any market or exchange, but may be provided by market makers, and so prices may not be accurate and may differ from the actual price at any given market, meaning prices are indicative and not appropriate for trading purposes. Fusion Media and any provider of the data contained in this website will not accept liability for any loss or damage as a result of your trading, or your reliance on the information contained within this website.
It is prohibited to use, store, reproduce, display, modify, transmit or distribute the data contained in this website without the explicit prior written permission of Fusion Media and/or the data provider. All intellectual property rights are reserved by the providers and/or the exchange providing the data contained in this website.
Fusion Media may be compensated by the advertisers that appear on the website, based on your interaction with the advertisements or advertisers.
© 2007-2024 - Fusion Media Limited. All Rights Reserved.