by Pinchas Cohen
Mario Draghi surprised FX traders on Tuesday. After repeatedly telling markets “…an extraordinary amount of monetary policy support…is still necessary,” yesterday, he spoke of “strengthening and broadening the recovery" in the eurozone while insisting stimulus must remain for now. However he hinted at a scale-down from the ECB's bigger-than-the-US balance sheet, perhaps as early as this fall.
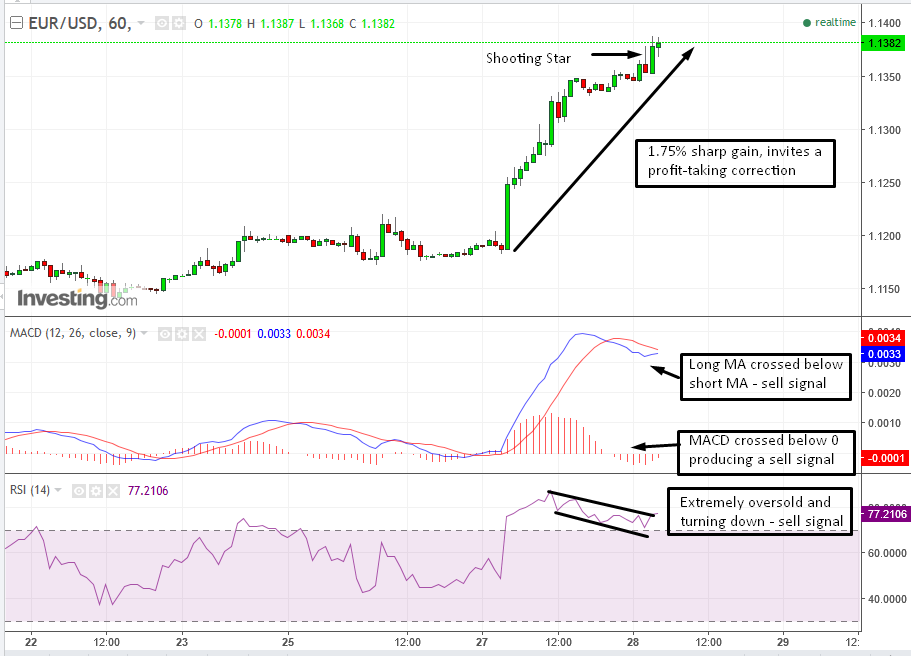
The euro leaped 0.4 percent within the first ten minutes after the remarks, 0.6 within the hour and continued to gain till 4:00 EDT today, rising 1.75 percent, to 1.1382.
Is It Too Late To Join The Party?

The euro just touched a one-year high in a very sharp, unexpected move. This presents an interesting opportunity for those wishing to get in on the trade now. The unexpected move means that some traders will want to secure their winnings and sell, in order to cash out. Both the MACD and RSI reached overbought territory and have produced sell signals, as they scaled back down toward equilibrium.
At 3:00 EDT, the price advanced but closed lower, forming a bearish Shooting Star, suggesting that after the bulls showed their hand, the bears believe their hand is actually better. In the following hour, price retested the Shooting Star’s resistance, peaked above it, but closed below it, confirming that resistance is intact.

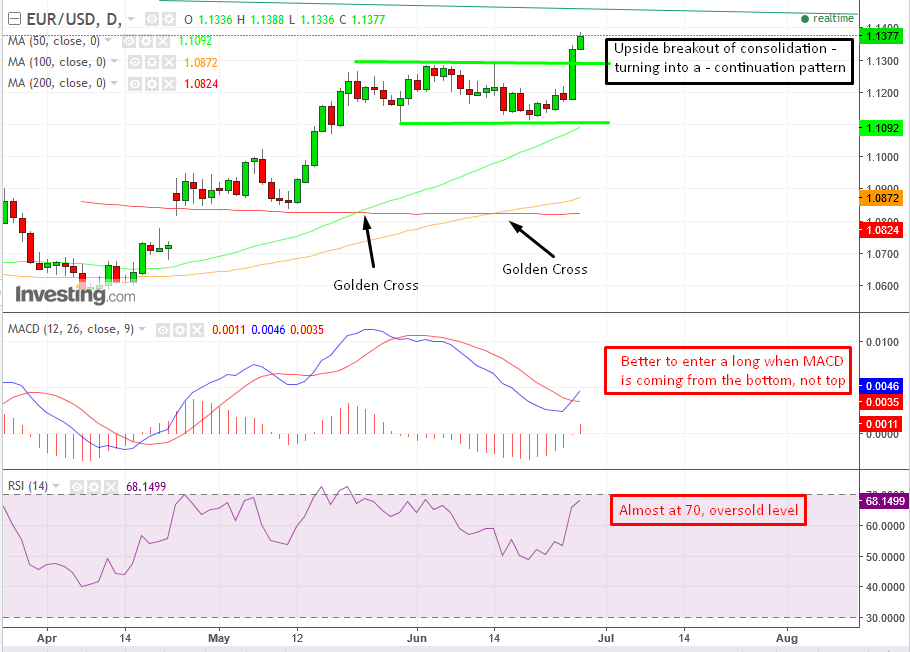
As is visible on the daily chart, the pair broke out of a consolidation pattern after completing a second Golden Cross, when the 100 dma (orange) crossed over the 200 dma (red) after the 50 dma (green) had already crossed over the 200 dma in late May—suggesting a $1.1400 price target.
However, both the MACD and the RSI are already high, favoring a correction.

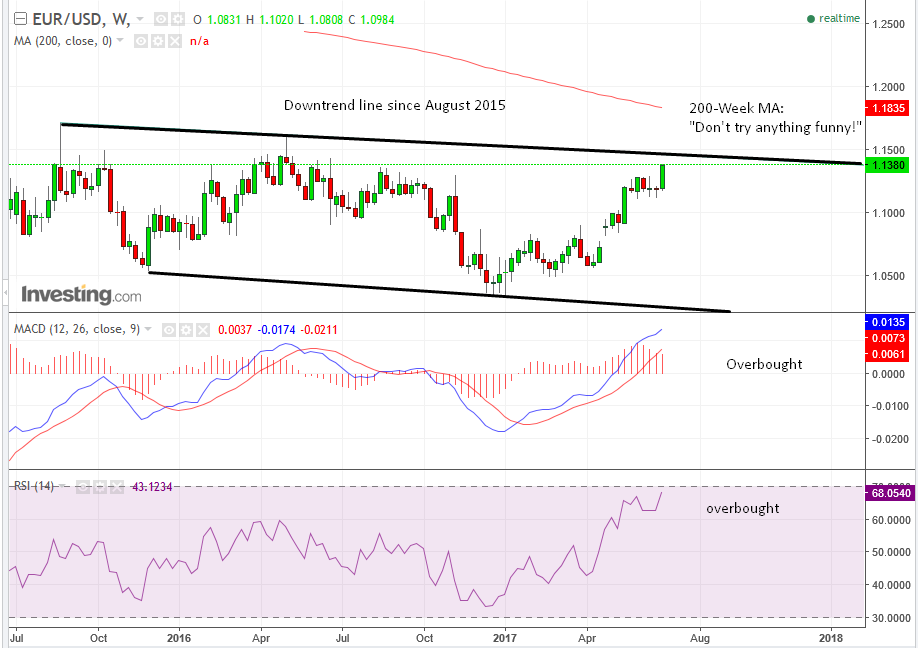
Most importantly, the rally is nearing the pair’s downtrend line since August 2015, with the 200-week moving average (red) making sure the price doesn’t try anything funny. On the weekly chart as well, both the MACD and RSI are overbought, suggesting a correction.
Trading Strategies
- Conservative or swing traders may wish to avoid a long position, despite the bullish breakout of the consolidation pattern visible on the daily chart, considering its come near its almost-2-year downtrend line.
- Moderate traders might wait for a pullback, as price retests the new support of the consolidation, allowing profitable traders to cash out and jump long as the price nears the 1.1300 level, with a view toward the 1.1400 price level.
- Aggressive traders may want to short, placing a stop loss above 1.1400, since the 3:00 high was 1.1388, and ride the presumed correction. If the euro-dollar nears the 1.1300 area, they may double back and go long to the 1.1400 price level.
