Microsoft (NASDAQ:MSFT) is scheduled to report earnings for the first quarter of 2018 today after the market close. Consensus forecasts call for EPS of $0.96 on revenue of $27.9 billion.
Will the software giant extend its winning streak, in which it has beaten estimates for the past four quarters? And if so, will Microsoft become the second company join the "Trillion Dollar Valuation Club?"
So far, only Apple (NASDAQ:AAPL) has achieved this singular status, though Amazon (NASDAQ:AMZN) briefly joined the club on an intraday basis, only to close below that level. As of Tuesday, Amazon shares finished at $1,768.70, making the company worth $862.67 billion; Microsoft closed yesterday at $108.10 per share, for a valuation that closely trailed Amazon, but still put it behind the internet retailing colossus—at $829.94 billion, a mere 3.8 percent difference.
During Microsoft's report today, markets will focus on two particular segments: growth in Productivity Business Processes and Intelligent Cloud. Unlike Apple and Amazon—which are companies that are constantly in the limelight—Microsoft sells products and services to professionals, making it a far less exciting business. But even if this stock isn't as sexy as some other large tech names, investors would be wise not to underestimate it.
CEO Satya Nadella has redoubled focus on cloud services as well as on reformatting the company's service-business structure into a subscription format. If these attempts have been successful and Microsoft earnings beat expectations, the company may just pull off the trillion-dollar milestone.

Professionals don’t analyze a company in a vacuum, since investors shift holdings based on performance. This is why we highlighted the seemingly external factor of which company reaches the trillion dollar milestone next. While this achievement may be primarily psychological, it definitely influences sentiment, which has a direct impact on supply-and-demand.
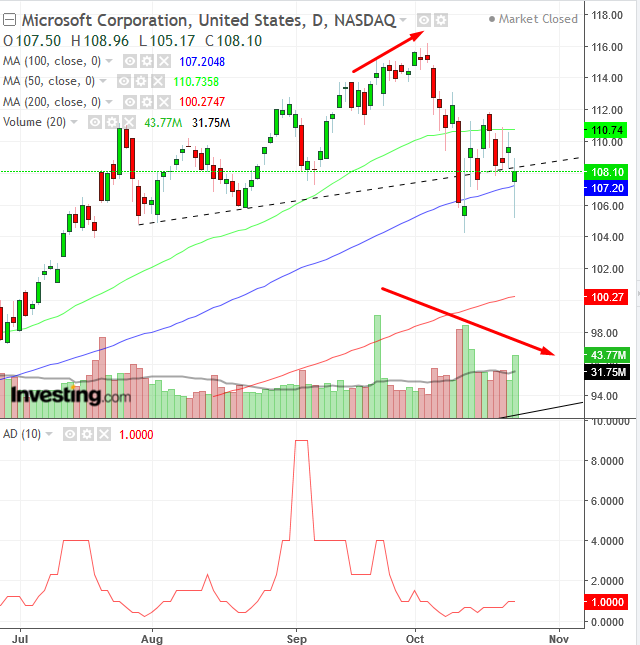
The comparative view is also applied to technical analysis. Microsoft rebounded back above the 100 DMA, while most stocks, including Amazon, remained below, giving MSFT a comparative advantage.
Also, unlike most stocks, the software giant did not register a trough lower than the October 10 low, sparing a call on a reversal. Furthermore, unlike most stocks, it is way above (specifically 13% higher than) its uptrend line since the last correction in February 2016. It is, however, right below its shallow uptrend since July 30.
However, positive earnings would undo that and may even retest the $116 record, 7 percent higher. In fact, the best rallies come after sharp selloffs, as traders rush in for what they suddenly consider a bargain.
The overall descending volume, down from the peak, demonstrates diminishing supply, suggesting the selloff will lose steam. Interestingly, the advance-decline line, which measures the total number of stocks that tick higher or lower, is showing signs of a bottom, suggesting stocks may still rise.
Trading Strategies – Long Position Setup
Conservative traders must wait for a new peak, past $116, to confirm the uptrend.
Moderate traders may risk a long-position with a close above $112, the October 17 high, with a close stop-loss, below the peak.
Aggressive traders may enter a long position now, providing their account management affords them a stop-loss below $104, the October 11 low, or the risk of losing the position. Alternatively, they can place a close stop-loss to fit their equity allowance.
Warning: In case of a selloff, unless a trader has a guaranteed stop-loss order on a CFD (requires a premium payment), equities experience slippage, a price gap during market volatility. If the market price skips over your stop-loss, your loss will run till the next market price, past your stop-loss.
Trade Sample – Far Stop-Loss:
- Entry: $108
- Stop-loss: 104, October low support
- Risk: 4
- Target: $124
- Risk-Reward Ratio: 1:3
Trade Sample – Close Stop-Loss:
- Entry: $108
- Stop-loss: $107
- Risk: $1
- Target: 111
- Risk-Reward Ratio: 1:3
- Target 2: 116
- Risk-Reward Ratio: 1:16
