Microsoft (NASDAQ:MSFT) has been outperforming the overall technology sector, rising year-to-date by 19 percent. The sector itself advanced less than 12 percent.
This superior performance isn't just for the current period. On a 12-month basis, shares of the software company increased by almost 40 percent, while the Technology Select Sector SPDR (NYSE:XLK), the ETF index of the tech sector climbed less than 29 percent.
As well, over the past five years, Microsoft gained 220 percent, handsomely outpacing the 132 percent surge in the overall technology sector over the same period.
At the heart of Microsoft's success is its ability to adapt to the rapidly changing technological landscape. Growth in Microsoft’s Azure division, solid market uptake of Office 365, the company's exceptional hybrid cloud and investments in AI, as well as an expanding computer market are among the things that should successfully take the company into the future.
Nonetheless, Google (NASDAQ:GOOGL) has proven to be a tough competitor. It gained market share with its Android OS, with a lower-priced Chromebook as well as with its solid control of the educational tech segment of the market.
But Microsoft knows how to adapt to a changing environment and that includes taking on the competition. In an effort to challenge Google in one of its key markets, Microsoft acquired Flipgrid, a startup that developed an app which allows students to record and share videos on educational topics with their classmates.

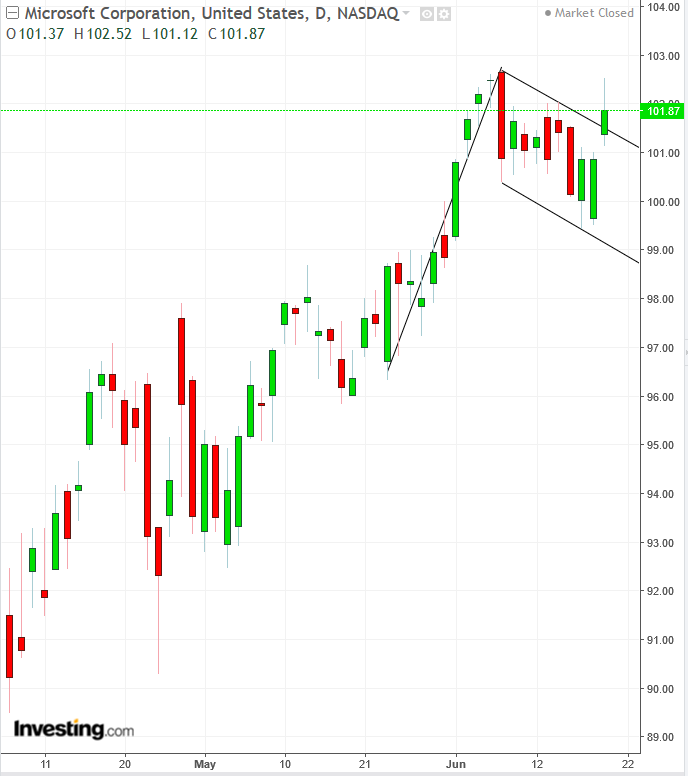
The stock has been moving mostly sideways after hitting a record on June 6. But what may look like meandering to the inexperienced eye is actually a take-profit consolidation by the name of “falling flag,” bullish after a sharp rally. The preceding jump from May 29, $97.23 low to the July 7 high of $102.69, over a 5-percent profit in a week, led bulls to lock in profits by cashing out. That’s what caused the downward biased congestion. The upside breakout confirms that there have been willing buyers, who are expected to keep bidding up the stock, while the initial bulls may join for another run.
Target: $106 ($5 expected move from pattern breakout at $101.50, based on move preceding pattern)
Warning: The breakout penetrated a mere 0.37 percent, falling well short of even an aggressive, 1.00 filter. Therefore, there is still the chance of a bull-trap.
Trading Strategies – Long Position Setup
Conservative traders would wait for another record to solidify the uptrend.
Moderate traders may risk a long position with another two closes above the pattern.
Aggressive traders might enter immediately, with a stop-loss beneath 101.00, the flag top.
Equity Management
Whatever your risk aversion, ensure a favorable risk-reward ratio of at least 1:3.
Trade Example:
- Entry: $102.00
- Stop-Loss: $101 Risk: $1.00
- Target: $106
- Reward: $4.00
- Risk-Reward Ratio: 1:4
