An array of drivers, including the OPEC+ pledge during the cartel's most recent meeting, to cut production and the subsequent follow-through, as well as a softer dollar are pushing the price of oil higher for a second day. Adding to the commodity's momentum: broader market enthusiasm due to vaccine progress even as the COVID contagion appears to be slowing.
Last month, Prince Abdulaziz bin Salman, Saudi Arabia’s energy minister, promised to deepen cuts by another 1 million barrels a day. News has leaked that members of the syndicate appear to have implemented 99% of their agreed production caps in December.
The weakened dollar-denominated price of oil has also rendered the commodity cheaper for importers.
Yesterday, the US equity rebound from the worst selloff since October improved the mood of investors, along with the new market narrative which indicates that the diminished volatility from retail traders during Monday's trade boosted confidence in market stability.
Topping off the optimism, the US reached a positive pandemic milestone, with more Americans having now received at least one dose of the vaccination—26.5 million people—verus the 26.3 million that have tested positive, according to Bloomberg. The news brightens the outlook for an economic recovery that could occur sooner, rather than later.
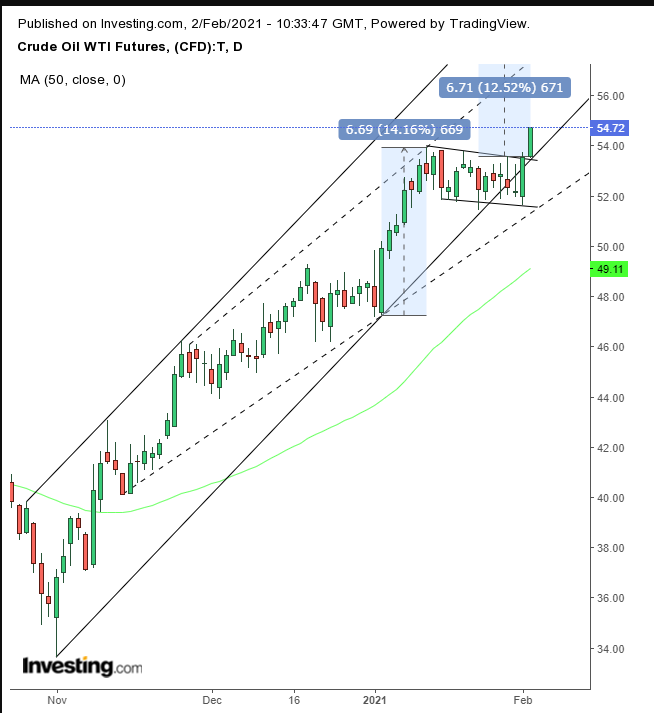
On cue, oil broke out of its trading range.

The commodity broke the topside of a rising flag, completing a pattern considered bullish after the 14% surge in just the seven sessions between Jan. 5 and Jan. 13 that preceded the range.
For traders, the pause in a rally is a time for reflection, particularly if they're ambivalent regarding a spike, as is the case here. They’re happy to be on the express train to profits, of course, but at the same time they question whether they've bitten off more than they can chew. As well, they'll question whether oil will soon fall back.
So this becomes an opportunity to realize profits even as they try and figure out their next move. This profit-taking is why the price has been in decline since the Jan. 13 high of $53.93.
On the other hand, the reason the flag’s drop was kept in-line in a crowded trade is that every contract sold found a willing buyer with enough conviction to take prices higher. When those who wanted out were gone, bulls once again took over, to repeat the same spike that preceded the flag. They raised their bids past the flag’s boundaries, to find new willing sellers, at higher prices.
This tilt in the supply-demand balance sets the price on a mechanism that is rigged to catapult via a momentum that repeats the rush that brought it into the flag the first time.
Note: the flag is complete when the upside breakout is on a closing basis, and traders employ time and/or price depth filters to limit the odds of a fake-out.
Trading Strategies – Long Position Setup
Conservative traders should wait for the price to close above $55, then await a return move to verify support above the pattern over at least a 3-day period that preferably includes a weekend.
Moderate traders could enter upon a buying dip, in which the price remained above the flag for at least two days.
Aggressive traders would buy upon a close of at least 1% above the flag, provided they accept the risk of being whipsawed and are prepared with a well laid trade plan.
Here’s an example:
- Entry: $54
- Stop-Loss: $53
- Risk: $1
- Target: $59
- Reward: $5
- Risk:Reward Ratio: 1:5
Author's Note: This is just a sample, not the analysis, which is in the body of the post. We don’t know the future, rather we are simply attempting to navigate the odds. Even if we’re right, the sample may fail. Even if the sample succeeds, your trade may lose, depending on your timing, budget and temperament. You need to understand and accept the risk, according to your personal circumstances. Otherwise do not enter a position as that will be gambling, not trading.
Which stock should you buy in your very next trade?
AI computing powers are changing the stock market. Investing.com's ProPicks AI includes 6 winning stock portfolios chosen by our advanced AI. In 2024 alone, ProPicks AI identified 2 stocks that surged over 150%, 4 additional stocks that leaped over 30%, and 3 more that climbed over 25%. Which stock will be the next to soar?
Unlock ProPicks AI