Unlike the US Federal Reserve, which has been going out of its way to assure investors it won't be raising rates anytime soon, Russia’s central bank hiked interest rates on Apr. 23, for the second time this year, from 4.5% to 5%. Compared to the US's near-zero rate, on the face of it, a bullish ruble position verus the dollar should be a no-brainer for traders.
So why has the RUB recently been sold off? Perhaps investors aren’t convinced of the European country’s economic stability given the sanctions imposed on it by the US because of the standoff over Russia's annexation of the Crimea as well as its treatment of anti-government activists domestically.
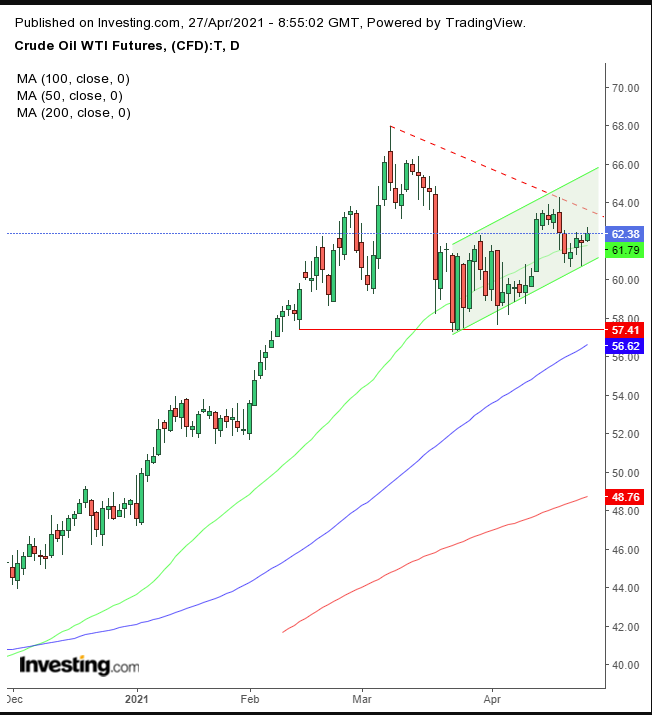
Plus if we’re right about oil's technicals, crude prices are likely headed lower, which means the ruble, as a petrocurrency, will probably suffer.

That possibility is currently being signaled in the daily chart for WTI. The energy commodity is retesting the top of a descending triangle which is formed when sellers continuously lower their offers, because buyers aren't showing a strong enough level of demand. A downside breakout would complete the pattern, as the level of seller panic rises since buying appetite shrinks, leaving anxious sellers increasingly willing to sell at any price.
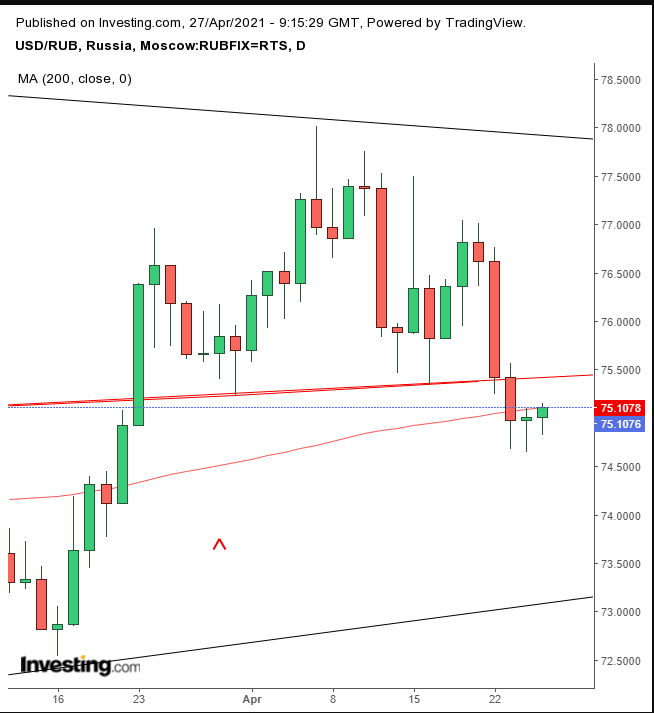
As for the USD/RUB, it completed a small H&S top, a reversal pattern.

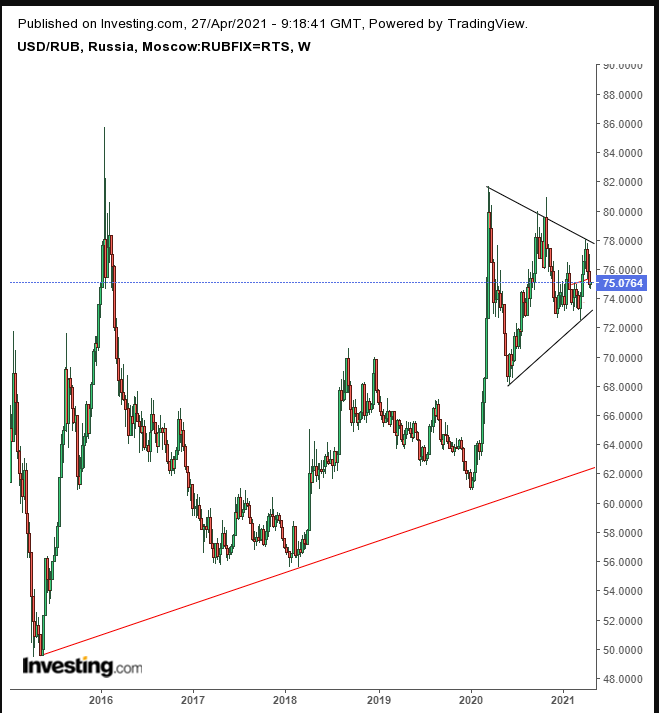
Since then, the price has been pushed down by the 200 DMA for a third day. The downside projection is even clearer on the broader, weekly chart.

The H&S’s target would be the bottom of a symmetrical triangle since the March 2020 peak. If the pattern fails, we can expect a plunge to retest the long-term uptrend since the May 2015 low.
Trading Strategies
Conservative traders should wait for a return move that will find resistance by the neckline before committing to a short position.
Moderate traders would wait for the corrective rally for a better entry, not necessarily for added confirmation.
Aggressive traders could short at will, if they accept the higher risk as the price for the higher potential reward which comes from being ahead of the rest of the market. Money management is key. If you don’t know how to do that, here is a basic trade format:
Trade Sample
- Entry: 75.0000
- Stop-Loss: 75.5000
- Risk: 5.000 pips
- Target: 73.5000
- Reward: 15.000 pips
- Risk:Reward Ratio: 1:3
Author's Note: We don’t know the future. We are just navigating a potential trade based on statistical results, which don’t always work out. Even if we’re right in our interpretation of the chart, the trade sample can still fail. It's subject to your timing, budget and temperament. Until you learn how to write a customized trading plan, you can use ours, for the purpose of learning, not profiting, or you’ll end up with neither.
