Saying that Moderna (NASDAQ:MRNA) was the best performing COVID-19 vaccine stock in the past year would be a laughable understatement. Shares of AstraZeneca (NASDAQ:AZN) gained 0.25% for the period; Pfizer (NYSE:PFE) added 3.1% of value. But Moderna blew past all of them, rising 687%.
Yesterday, we noted that Pfizer’s technical chart suggests a selloff could be in the cards. Today we'll be providing both bullish and bearish setups for Moderna since the biotech stock has reached an inflection point based on its technicals.
But perhaps the key fundamental question is why Moderna shares have so overwhelmingly outperformed the competition?
The efficacy numbers tell the story. Moderna's vaccine demonstrated 95% effectiveness in prevention of coronavirus and was 100% effective when used to combat severe cases of the virus.
Based on those results, 30 countries approved the use of Moderna's vaccine. The Cambridge, Massachusetts-based company has already earned $2.89 billion and is expected to receive another $11.7 billion this year from this vaccine alone. But that’s only the beginning.
The biotech is now running clinical trials in order to expand the use of its vaccine to young children and adolescents. It's also testing a booster shot for adults, with which to extend the efficacy of the immunization. If successful, this could also mean additional, guaranteed revenue on an annual basis.

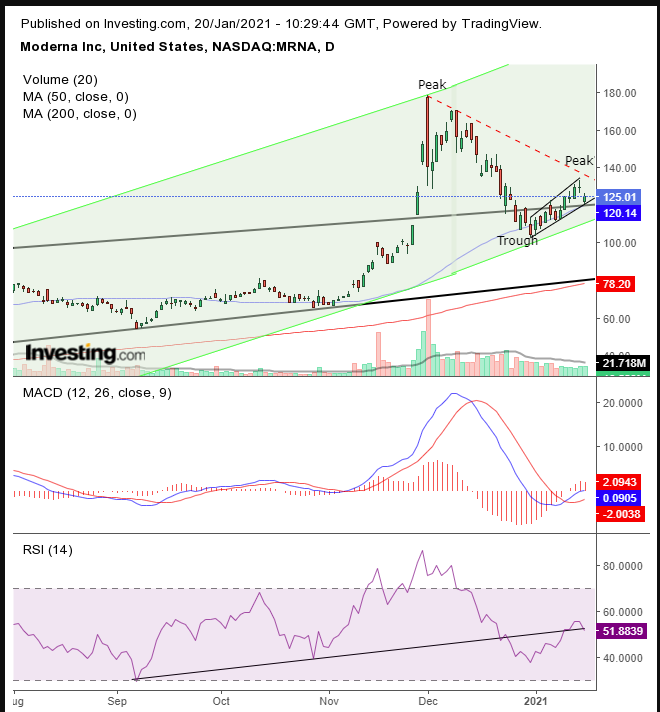
The stock has been trading within a rising channel since May, but broke through the channel top in November, after which it reached an all-time high of $178.50 on Dec. 1.
Moderna then corrected, losing 42.5% over the course of the month, till Dec. 31. The drop sent the price below the channel top on Dec. 28. Then the stock managed to pierce the channel top a second time, on Jan. 12, climbing once again until Jan. 15. Yesterday, the stock dipped, but found support at the top of the previous channel.
The obvious question of course is what happens next? While, we don't know, we can at least navigate probabilities.
On its face, this pattern appears to support the view that the new, steeper rising channel is intact, providing a buying opportunity, with the expectation the price will bounce off the bottom of the new (green) channel, to retest its all-time high, as it resumes moving along the rising channel’s trajectory.
However, the congested range in which the price rose 21% just this month is a cause for concern. It could be a developing rising flag, bearish after the preceding 40+% plunge in exactly one month. The diminishing volume amid the price advance increases the possibility of that scenario.
But the flag’s location is also significant. It developed at the crossroads of the former channel top, the foot of the potential new channel bottom at the 50 DMA and it meets the downtrend line from the December record high. All this signifies that the price has reached a focal point, and is set for an explosive move.
While the lagging MACD is still in a bullish cross since this month’s rebound, the sensitive RSI is retesting its uptrend line after falling below it and climbing back above it. In other words, momentum, too, is on the edge of a knife, much like the price is in the eye of the storm.
A downside flag breakout would demonstrate a continued decline from the Dec. 1 all-time high, to retest the original channel bottom at $80. If the price breaks through the downtrend line (dotted red), and preferably through the flag top, the odds would increase of it retesting the record.
Trading Strategies
Conservative Short: wait for second trough to establish a downtrend, followed by a return move.
Conservative Long: wait for breakout above the downtrend line, followed by a dip that demonstrates support.
Moderate Short: wait for a 3% (preferably, including a weekend), 3-day downside penetration, followed by a return move.
Moderate Long: wait for a breakout above the downtrend line.
Aggressive Short: wait for a 2% downside breakout, followed by return-move, demonstrating resistance.
Aggressive Long: buy now, provided you understand and accept the risk and prepare with a coherent trade plan.
Here’s just an example:
Trade Sample – Aggressive Long
- Entry: $124
- Stop-Loss: $119
- Risk: $5
- Target: $174
- Reward: $50
- Risk:Reward Ratio: 1:10
Which stock should you buy in your very next trade?
AI computing powers are changing the stock market. Investing.com's ProPicks AI includes 6 winning stock portfolios chosen by our advanced AI. In 2024 alone, ProPicks AI identified 2 stocks that surged over 150%, 4 additional stocks that leaped over 30%, and 3 more that climbed over 25%. Which stock will be the next to soar?
Unlock ProPicks AI