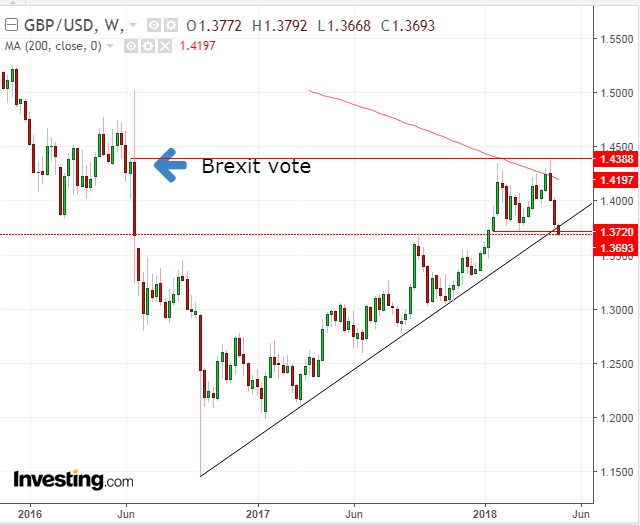
The pound reached a two-month low due to disappointing economic results and government instability, resulting in the BoE delaying an anticipated May hike as well as any expectations for a hike before 2019.
UK factory growth dropped to a 17-month low in April, adding anxiety after the weakest quarterly growth since 2012. Manufacturing PMI dropped to 53.9 from 54.9, missing estimates of 54.9 as well. This comes on the heels of other disappointing data.
If workers were to sit around and not produce for three months, bosses would justifiably fire them. This, in essence, is what FX traders did to the pound after they realized that the UK economy had come to a virtual standstill for the first quarter of 2018. The economy had grown a meager 0.1 percent, down from 0.4 percent during the previous quarter, not even within the ballpark of the 0.3 percent forecast by analysts.
Economists blame UK economic weakness on a downturn in household demand, due to the significant reduction in the buying power of the pound since it lost 20 percent of its value in the aftermath of the June 23, 2016, Brexit vote through the beginning of 2017. That's slightly ironic considering the currency nearly regained all of its pre-Brexit referendum value from January through April of this year. Still, the acute devaluation of the pound sterling spiked inflation, eroding real incomes, limiting household spending and ultimately slowing economic growth.
Why Sterling Will Continue To Fall (And Hard)
Further uncertainty is weighing on the pound, from a divided cabinet and the resignation yesterday of Home Secretary Amber Rudd due to yet another scandal. Prime Minister Theresa May is losing an ally at a critical time, and traders are left with lingering questions as to whether the risk of Brexit is already priced into the pound. Put another way, if the UK economy has been slowing on the aftermath of a vote on Brexit, what might happen to it after the UK actually disengages from the EU?
Meanwhile, big firms like Barclays and Nomura see a bottom for the currency. We, however, see a top.
What do you see?
The pound has crossed below its uptrend line since the October 2016 1.1452 bottom for the first time. In the same time, it completed a double bottom on an intraday basis, since late January. Should the GBP remain below the $1.37 double-top neckline, it would seal a breach of two key technical levels, lending gravitas to an assertion of a top.
It may also be more than poetic that the 1.4378, April high reached a mere 10 pips below the 1.4388 weekly closing price before the June 2016 Brexit vote. It's called resistance, a key price that investors remember to be meaningful and don't believe that the price will surpass. The 20 percent plunge that followed may have something to do with their position.
The weekly 200 DMA topped the price out at that exact level, while the daily 200 DMA waits to attempt a support at the 1.3500 level.
The double top implied target is eyeing the 1.3100 level.

