After years of repeatedly amazing skeptics on its potential as an electric car manufacturer, as well as its ability to deliver finished product and shareholder profitability, Elon Musk's Tesla (NASDAQ:TSLA) has once again surprised. As of Dec. 21, the Palo Alto, California-based company will now also be listed on the S&P 500.
Shares of the high-flying stock jumped close to 13% in after-hours trade post the late-Monday announcement. This latest feat isn't inconsiderable. In order to be approved for listing on the benchmark index a company must be able to show four consecutive profitable quarters, something that was, until recently, difficult for the Silicon Valley carmaker to accomplish.
The stock has soared in 2020, gaining more than 400% since the start of the year. It closed yesterday at $441.61.
Along with the additional prestige, Tesla will enjoy automatic, added demand because of the listing. According to the Wall Street Journal, "analysts expect the addition to further boost Tesla’s...shares because some $11 trillion in mutual funds and other investments track the S&P 500, many of which will now need to buy them," [the shares], along with the remaining 499 companies in the index.
No surprise then that Morgan Stanley just turned bullish on Tesla, for the first time in over three years. The bank gave the company an enthusiastic thumbs up with an overweight rating.
That's a profound shift from where Tesla was on Sept. 9. The stock was falling hard, having lost 34% of its value when it dropped to $330. That selloff followed the SPX's rejection at that time regarding listing the company on the index.
Nevertheless, shares jumped during trading that day and have been rising steadily ever since. Based on fundamentals, as well as technicals, TSLA looks set to rev higher still.

This week's announcement propelled shares as much as 12.8% higher. Yesterday the stock locked in an 8.2% gain.
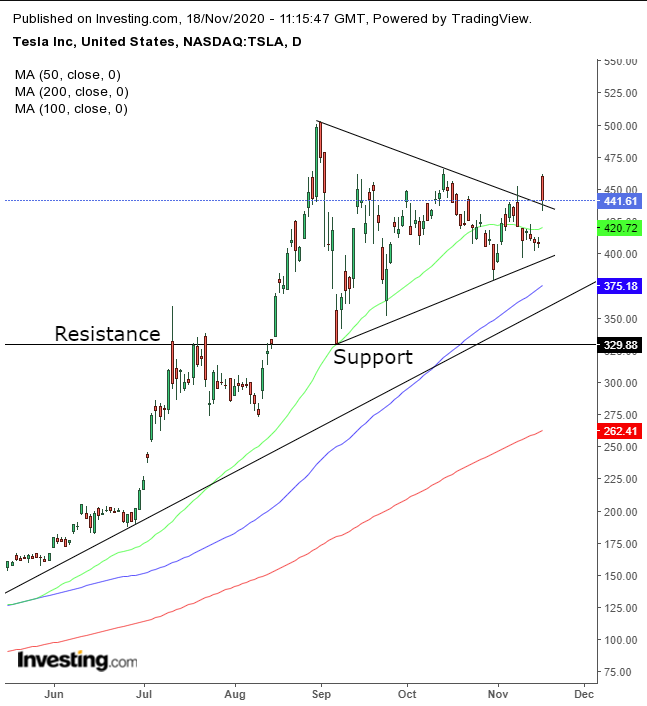
The trading pattern is telling. When the stock trimmed its gains, it penetrated slightly into, but closed right above, a symmetrical triangle, in place since the previous announcement of its SPX rejection.
The outside breakout demonstrates that demand absorbed all of the supply. The return into the pattern—presumably on profit-taking—found more demand, sufficient to maintain it above the triangle top, as still-hungry traders upped their bids in order to find more, willing sellers.
Mapping the moving averages reveals broader trends. The 50 DMA supports the price; the 100 DMA supports the entire pattern, and the 200 DMA approaches the base of the pattern, having found support where there was resistance in July.
The height of the pattern encapsulates the full spectrum of emotions traders experienced. It's projected to repeat itself in the direction of the breakout. Therefore, the triangle’s height of $170+ is the implied target from the point of the breakout—leading to about $610. However, the round $600 figure can act as a major resistance, so we’re not aiming past that, at this point.
Trading Strategies
Conservative traders should wait for a long position with a new high, above the Sept. 1, $502.49 figure, then wait for a return move to confirm the pattern’s integrity.
Moderate traders are likely to wait for the same pull-back, but for a better entry, if not for proof of trend.
Aggressive traders will enter now.
Trade Sample
- Entry: $440
- Stop-Loss: $430
- Risk: $10
- Target: $500
- Reward: $60
- Risk:Reward Ratio: 1:6
