Yesterday, after the Trump administration scrapped plans}} to blacklist Chinese tech giants Alibaba (NYSE:BABA), Baidu (NASDAQ:BIDU) and Tencent (OTC:TCEHY), shares of Alibaba jumped 4.3%.
While that was immediate good news for the Hangzhou, China-based e-commerce giant, the longer-term outlook for the company's stock isn't quite so optimistic. Shares of BABA have been sinking since October, shortly after the company's founder, Jack Ma, made remarks critical of China's financial regulatory environment.
Soon afterward, authorities abruptly canceled what was billed as the world's biggest IPO, of Ma's fintech Ant Group, and began cracking down on the founder and his businesses. That triggered a selloff in Alibaba shares which began just after the stock reached an all-time high just below $320. The stock is now 26% lower, even after yesterday's surge, and remains on track to sink yet further.
That's because, since Ma voiced his criticism of China's financial authorities, he's disappeared. Rumors are now circulating that the government plans to nationalize both Ant Group and Alibaba.
That could drive yet more pessimism on the stock. As well, yesterday’s price action suggests the bears are still in control.

While the price jumped 4.5% yesterday, it gave up an earlier 6.7% advance. Why would there already be selling on a day of positive news?
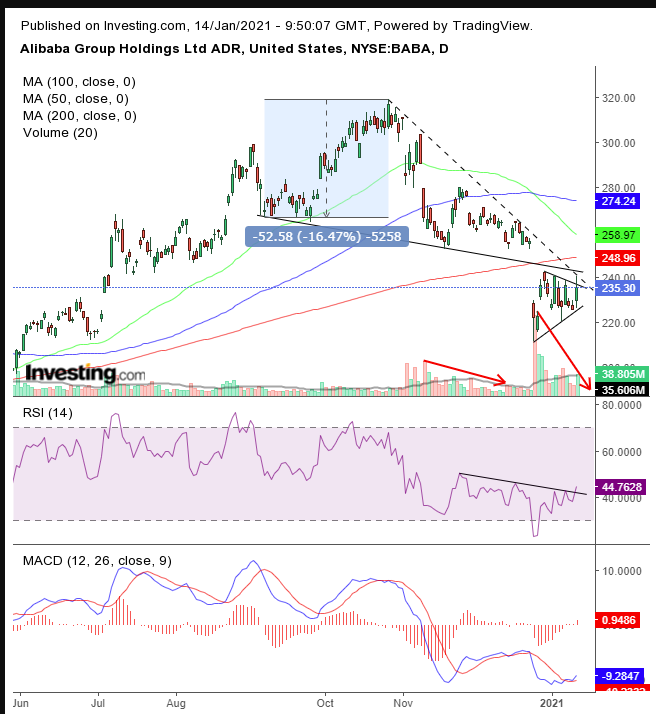
The price backed away from the top of a pennant, bearish after the 14.4% plummet on Dec. 24 when China announced it had launched an antitrust investigation into the tech giant. Though many analysts remained bullish on the stock, shortly afterward {{art-200549135||we warned there was likely more pain ahead after the stock completed a H&S top.
Since then, the stock has been trading according to the bearish pennant—as part of a “return move” to retest the pattern’s integrity—reinforced by the neckline of the H&S and by the (dotted) downtrend line from the head of the H&S.
Notice that the volume increased with the drop from the head to the neckline, while it has been drying out against the rising price within the pennant, providing negative divergences.
The 50 DMA plunged below a then-rising but now-falling 100 DMA and is rushing toward the 200 DMA, which points to the X that marks the spot of the focal point of so much interest, threatening a Death Cross.
The implied target of the H&S—measuring from the top to its Sept. 4 low—puts the $190 level in crosshairs.
Caution: Both the MACD and the RSI delivered bullish signals as they bottom out. So proceed with care.
Trading Strategies
Conservative traders should wait for the pennant's completion, with a downside breakout that should take it below the pennant’s low point. Then there could be an attempt to rally on a short squeeze, only to be blocked by the resistance of the downtrend.
Moderate traders would wait for the downside breakout, then may wait for a corrective rally for a better entry point.
Aggressive traders could short now, considering the proximity to the neckline provides a favorable risk-reward ratio, as long as they understand and accept the risk of a lack of confirmation. Therefore, tighter money management to compensate for the higher exposure is crucial for ongoing trading success.
Here’s just an example:
Trade Sample – Contrarian Short Position
- Entry: $240
- Stop-Loss: $245
- Risk: $5
- Target: $210
- Reward: $30
- Risk:Reward Ratio: 1:6
