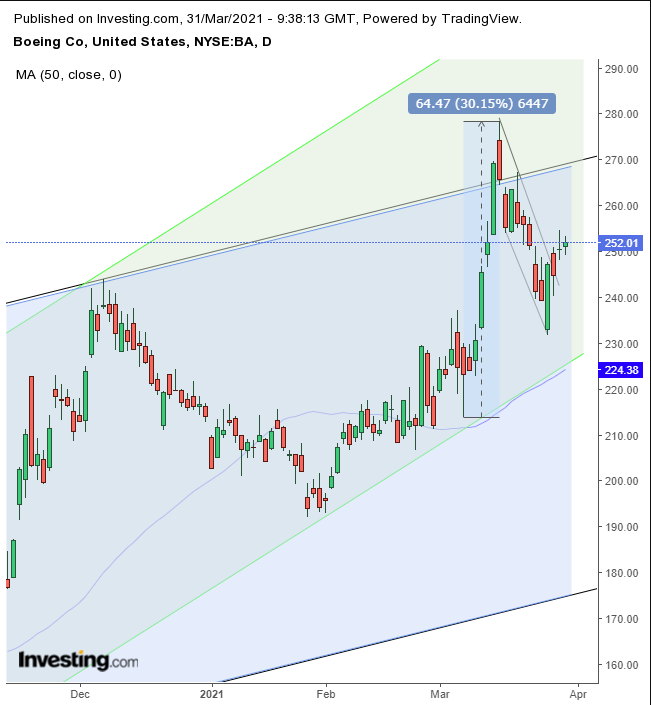
After Southwest Airlines (NYSE:LUV) agreed to purchase an additional 100 Boeing 737 MAX jets earlier this week, shares of the aerospace giant took flight. On Monday, Boeing (NYSE:BA) closed almost 3% higher, boosting the Dow Jones Industrial Average on which it's listed, to a new record, even as the S&P 500 slipped 0.3%
The new orders brought the total number of jets Southwest was purchasing from Boeing to 350, with an option to buy an additional 270 planes. As part of the reconfiguration of this previously troubled model, Boeing has also improved the jet’s fuel efficiency, which is expected to increase demand, since the enhancement makes it worthwhile for airlines to retire older jets more quickly.
To that end, on Tuesday, Alaska Air Group (NYSE:ALK) announced it had ammended an existing deal with Boeing, and will now be purchasing an additional 23 737 MAX aircraft.
As well, Boeing is benefiting from the reflation trade, as economies reopen and travel and business activity accelerate.
Based on the technical chart, however, it could be fair to deduce that “informed money” may have already been building positions, perhaps in anticipation of good news.

Boeing shares have been declining within a congested range after vaulting higher by 30% within the single week that preceded the falling flag. This pushed the stock temporarily above its rising channel since its March bottom.
The profit-taking that followed flooded the market with shares, but the decline that then occurred did not match the intensity of the preceding rise—not by a long shot. The dip was slow and incremental, supported by abundant demand.
So who was doing the buying? New, random bulls who had missed out on the previous surge or perhaps an inner circle of individuals connected to the people involved with the increased order flow?
Of course, we don’t know. But then it really doesn’t matter.
Ultimately, from here on we expect the same market follow-through. Demand exceeded supply, pushing buyers to up the ante in search of new sellers at even higher prices. This cycle will continue, creating a technical snowball effect that is likely to push the price out of its current rising channel and into a steeper trajectory.
Trading Strategies – Long Position Setup
Conservative traders should wait for the price to close above Tuesday’s high-wave doji, to knock out the resistance, then for prices to remain above the flag for at least a three-day period, before risking a long position.
Moderate traders would buy the potential dip of a return move.
Aggressive traders could enter at will, having accepted the higher risk as the price for their expectation of a higher return, as they seek to capture a trade before it gets away (in case there is no pullback), rather than waiting for confirmation. As always, money management is essential.
Here’s an example:
Trade Sample
- Entry: $250
- Stop-Loss: $240
- Risk: $10
- Target: $280
- Reward: $30
- Risk:Reward Ratio: 1:3
