- Bitcoin's surge to the $52,000 range was fueled by strong demand for the spot Bitcoin ETF.
- This rally is currently showing resilience even as this week's CPI data exceeded expectations.
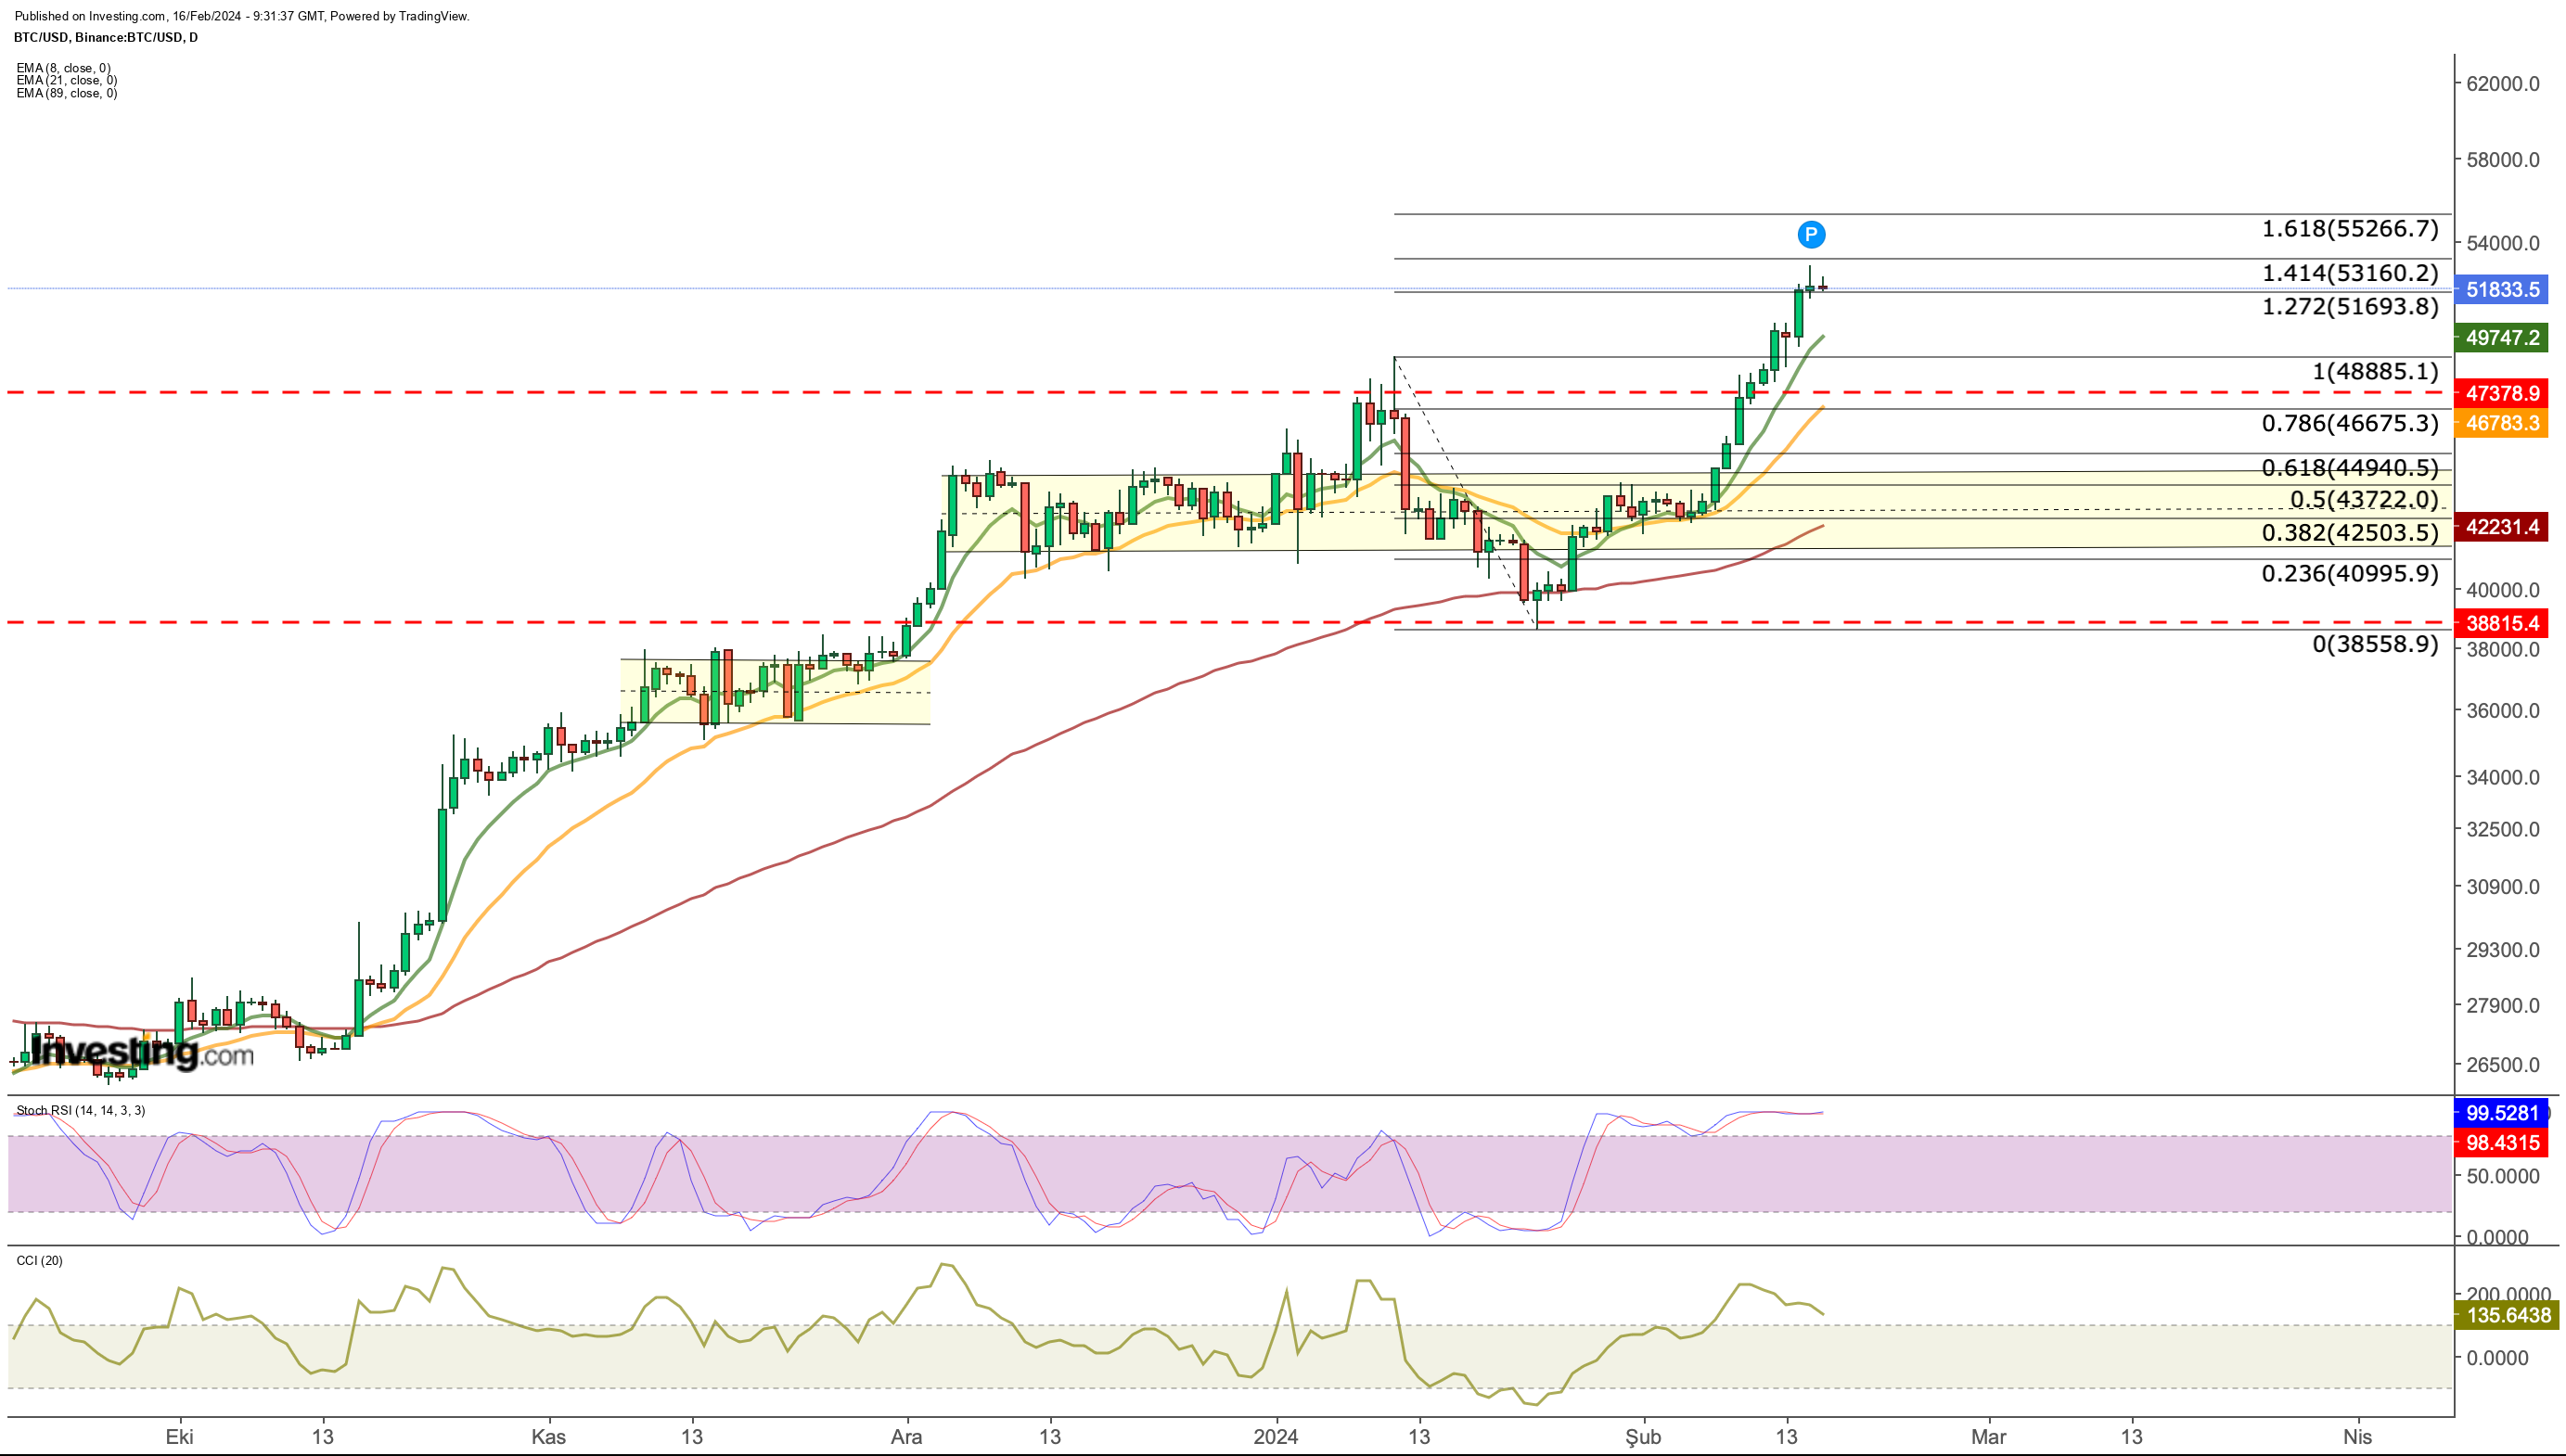
- Facing short-term resistance at $51,700, Bitcoin needs to surpass this level and reach $53,000 for confirmed support, targeting $55,000.
- In 2024, invest like the big funds from the comfort of your home with our AI-powered ProPicks stock selection tool. Learn more here>>
(Bitcoin) has been on a steady uptrend since the start of the month, driven primarily by demand for the spot Bitcoin ETF.
Notably, the upward momentum remained robust even when this week's CPI data came above expectations, briefly creating a panic atmosphere in the market.
However, a key point of consideration is the emergence of short-term resistance at this juncture.

Bitcoin has encountered resistance at the $51,700 level, which is the lower boundary of the Fibonacci expansion zone based on the recent correction, after experiencing fluctuations between the January peak of $48,800 and the bottom price of $38,500.
The cryptocurrency needs to surpass this resistance and climb to $53,000 to establish it as a confirmed support level. If successful, the next potential target is $55,000 (Fib 1.618).
As of yesterday, $51,700 serves as the pivotal point. A daily closing below this price could signal a retracement towards an average of $49,500.
A breach of this support might extend the correction, heading towards the $46,000 region. Bitcoin has displayed overbought conditions on the daily chart, primarily driven by ETF-backed purchases.
Trading around the $51,700 mark appears critical, indicating a potential short-term correction based on the current outlook.
Bitcoin Weekly Chart Analysis
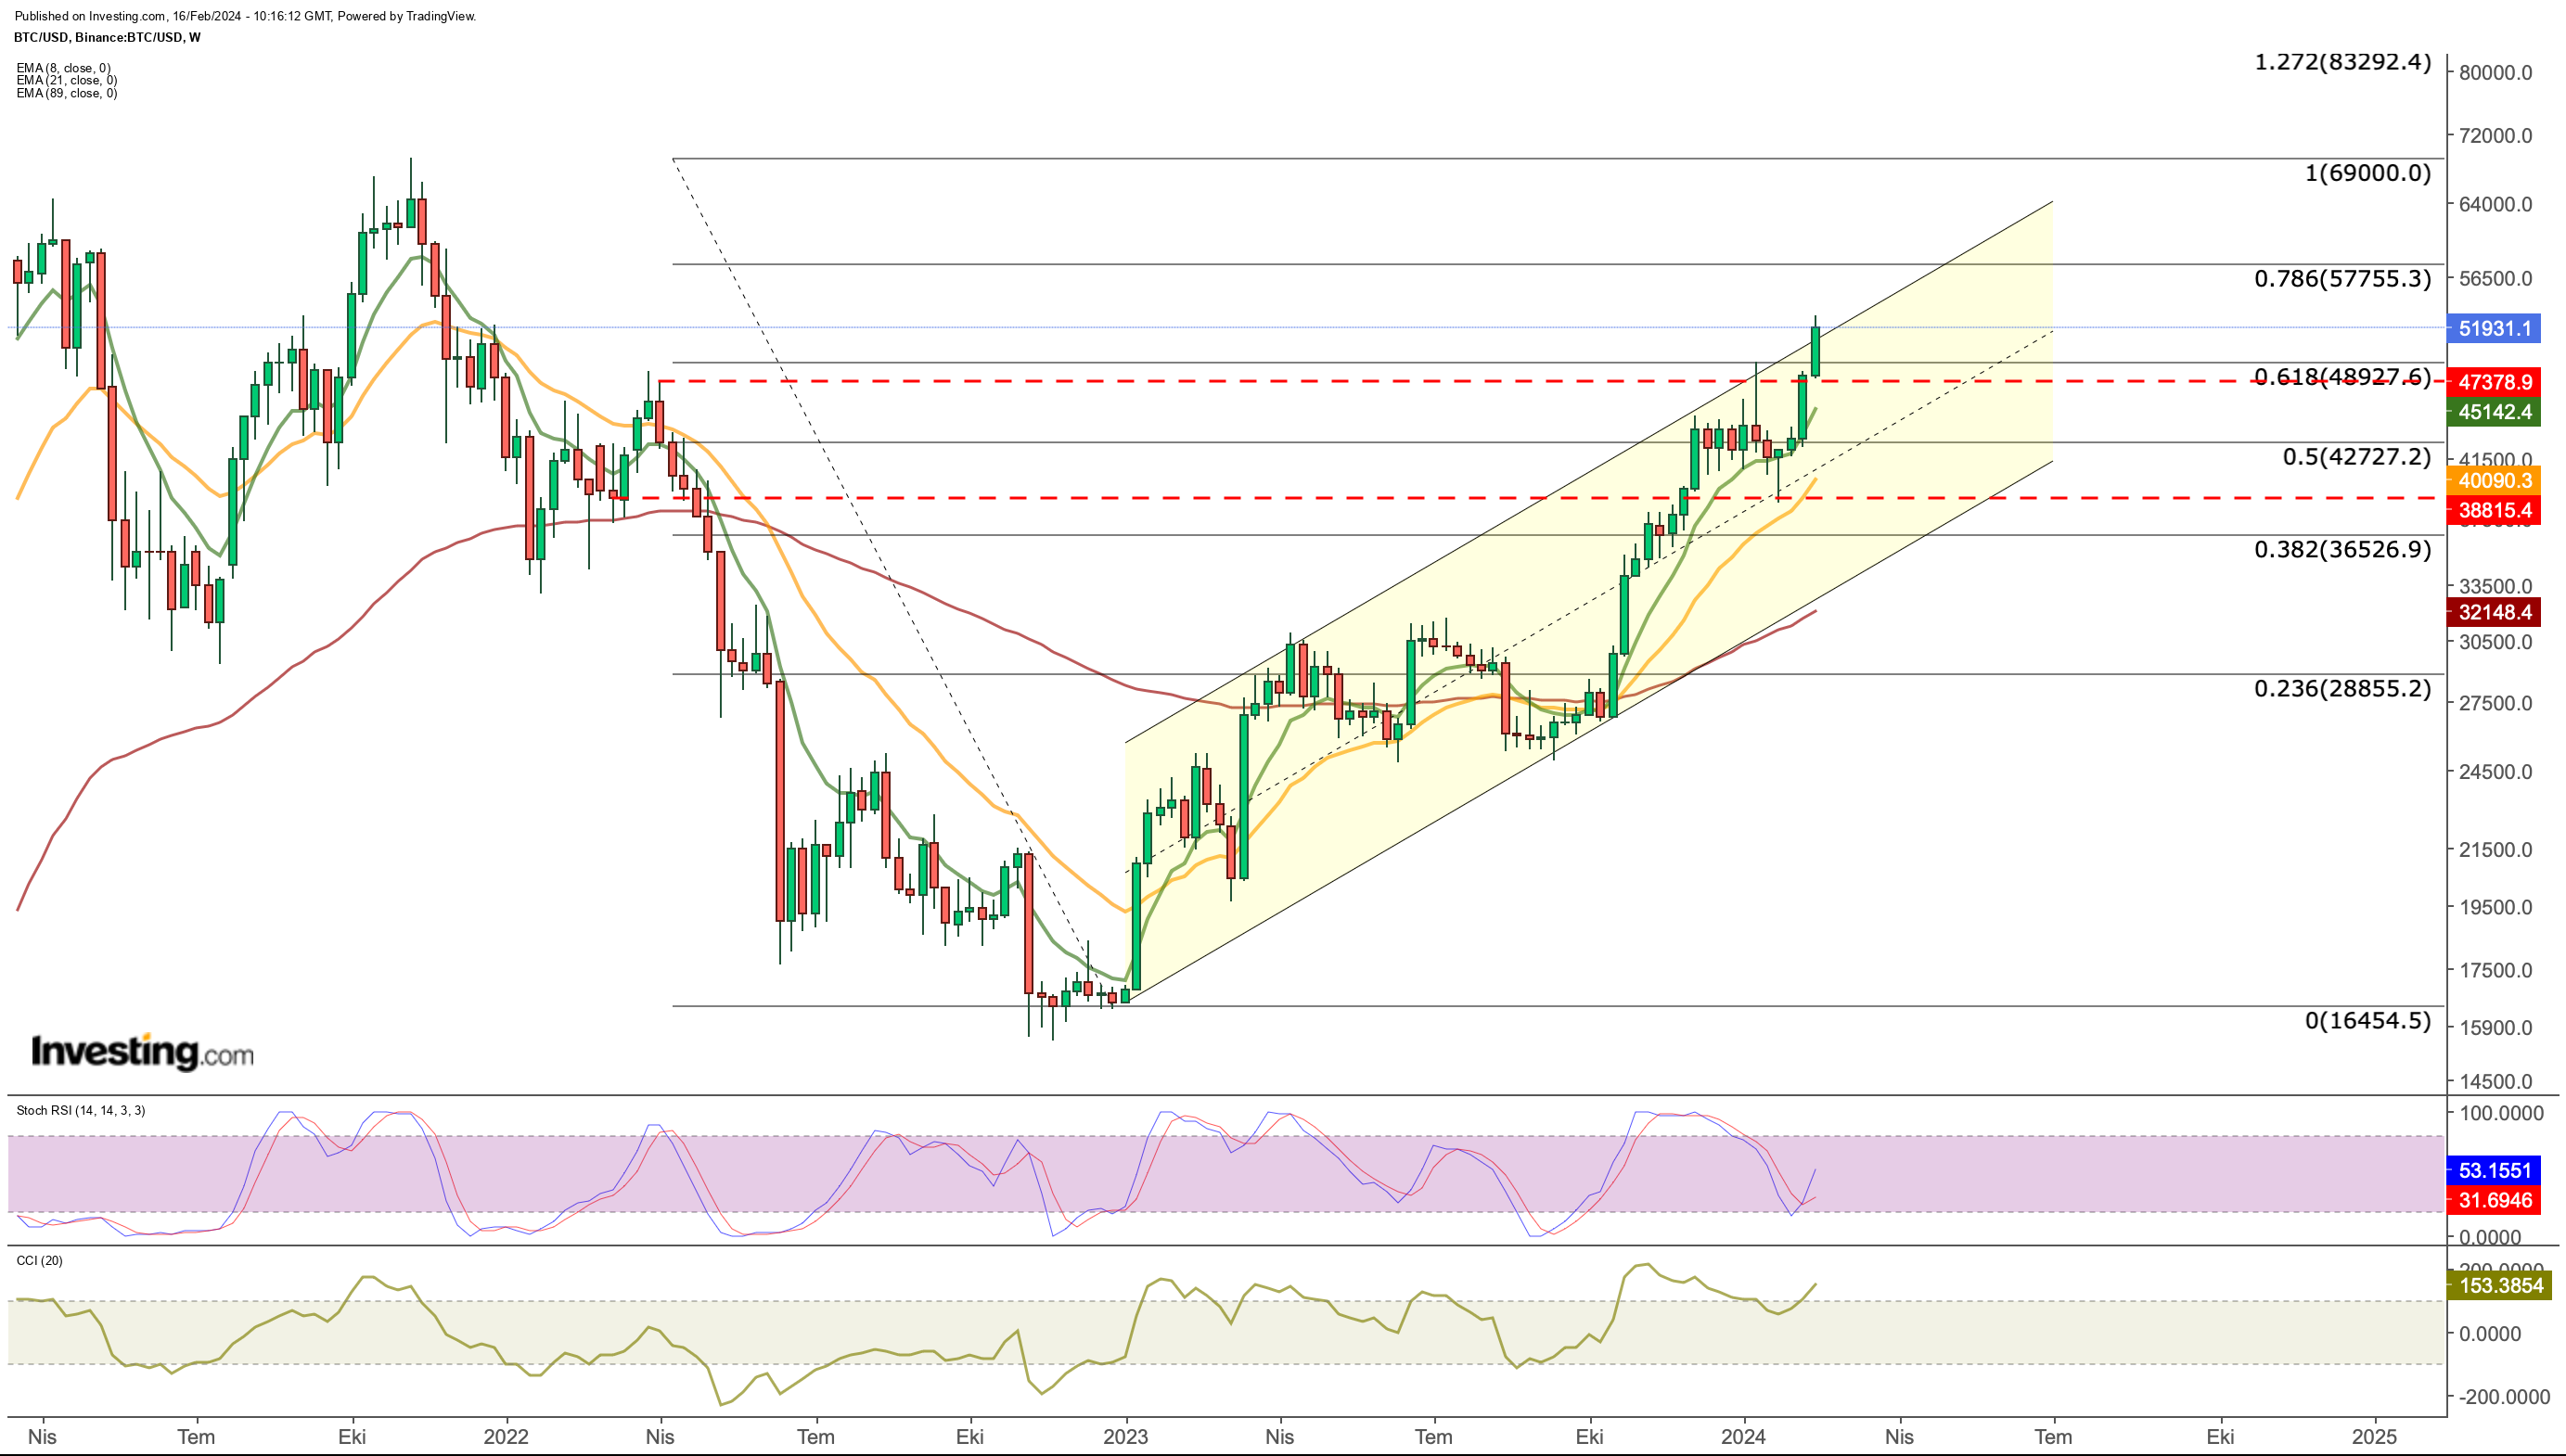
If we check the last one-year trend with the weekly Bitcoin chart, it shows that the price attempted to breach the upper line of the ascending channel this week.

Bitcoin made a crucial breakthrough this week by surpassing the $49,000 level, aligned with the long-term Fib 0.618.
The significance of this move cannot be overstated. If buyers successfully defend Bitcoin against potential sales in the $46,000 - $49,000 range, considering its overbought conditions in the short term, the next target could be Fib 0.786 at $57,700.
Looking ahead, the ETF trade that fueled Bitcoin's ascent might face headwinds this week, pending court approval for Genesis to sell its GBTC shares.
The timeframe for this sale remains uncertain, but with Genesis holding $1.3 billion worth of GBTC, it introduces an element of pressure. Additionally, profit sales from the current region may exert short-term downward pressure on the price.
Conversely, the extension of the interest rate cut expectation into the second half of the year dampens enthusiasm in risk markets.
While the US dollar maintains bullish strength, Bitcoin's appreciation amid a sustained uptrend in DXY underscores the resilience of the rally.
The upcoming halving event in April, reducing Bitcoin supply in the face of high demand, acts as an additional catalyst for its rise.
Consequently, the current outlook suggests a choppy trend until the second quarter, with the uptrend potentially gaining strength in June as the Fed initiates the interest easing process.
This is contingent on an increase in risk appetite. However, investors should remain prepared for emerging risks during this period.
***
Take your investing game to the next level in 2024 with ProPicks
Institutions and billionaire investors worldwide are already well ahead of the game when it comes to AI-powered investing, extensively using, customizing, and developing it to bulk up their returns and minimize losses.
Now, InvestingPro users can do just the same from the comfort of their own homes with our new flagship AI-powered stock-picking tool: ProPicks.
With our six strategies, including the flagship "Tech Titans," which outperformed the market by a lofty 1,427.8% over the last decade, investors have the best selection of stocks in the market at the tip of their fingers every month.
Subscribe here and never miss a bull market again!
Don't forget your free gift! Use coupon code UKTopDiscount at checkout for a 10% discount on all InvestingPro plans.
Disclaimer: This article is written for informational purposes only; it does not constitute a solicitation, offer, advice, or recommendation to invest as such it is not intended to incentivize the purchase of assets in any way. I would like to remind you that any type of asset, is evaluated from multiple points of view and is highly risky and therefore, any investment decision and the associated risk remains with the investor.

