Profits in ASOS dived 68% to £33.1 million on the year whilst sales grew 13% to the year end in August and revenues smashed £2.7 billion.
Why such heavy losses?
ASOS (LON:ASOS) will be glad to put the past financial year behind it. The eye watering losses come after a year of transformation at a large cost. ASOS spent heavily on installing robots in its warehouses and expanding its facilities in US in a sizeable transformation across two continents. By its own admission ASOS underestimated the cost and complexity of becoming an international player.
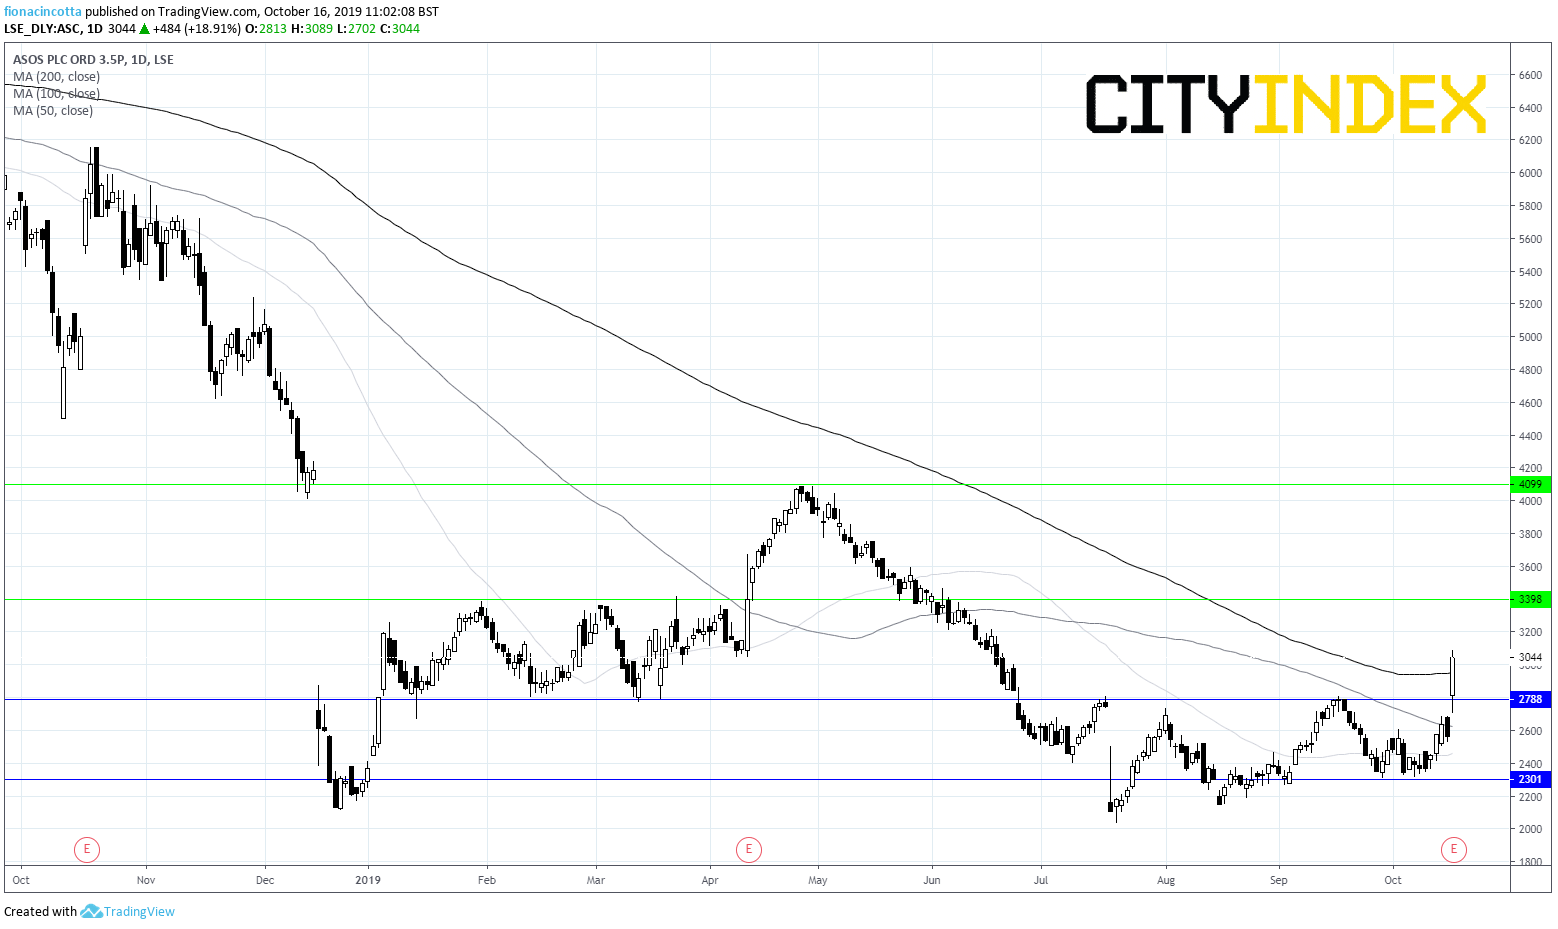
After two profit warnings across the year, the dire full year profit was in fact in line with expectations. The share price was down 50% from 12 months earlier, when it traded at 5000p. At the close yesterday ASOS (LON:ASOS) was down at just 2560p. However, despite the massive slump in profits, the share price has jumped 19% in early trade.
Why the rally?
Investors are optimistic that after expensive restructuring across last year, ASOS (LON:ASOS) is in a better position to face the challenges ahead. There is hope that these results represent a line being drawn under last years’ troubles.
So Is it enough to push shares back towards £50?
Whilst ASOS (LON:ASOS) has enjoyed rapid growth across recent years, competition is heating up from the likes of Boohoo and Next. Gone are the days when ASOS had the online fashion marketplace to itself. There is still much work to be done for ASOS to regain it online crown. Given the increasingly competitive environment and consumers potentially reining in their spending ASOS could struggle to reach its former glory.
Levels to watch:
ASOS (LON:ASOS) has jumped 19% in early trade talking it above its 200 ma, whilst it already traded above it 50 sma & 100 sma. The share price has broken out of the channel that it has traded in since mid-July. We would now look for a move above 3400p, which could open the door to resistance in the region of 4050-4100p. On the downside a drop back below 2790p could open the door to strong support at 2300p.

Disclaimer: The information and opinions in this report are for general information use only and are not intended as an offer or solicitation with respect to the purchase or sale of any currency or CFD contract. All opinions and information contained in this report are subject to change without notice. This report has been prepared without regard to the specific investment objectives, financial situation and needs of any particular recipient.
Any references to historical price movements or levels is informational based on our analysis and we do not represent or warrant that any such movements or levels are likely to reoccur in the future. While the information contained herein was obtained from sources believed to be reliable, the author does not guarantee its accuracy or completeness, nor does the author assume any liability for any direct, indirect or consequential loss that may result from the reliance by any person upon any such information or opinions.
