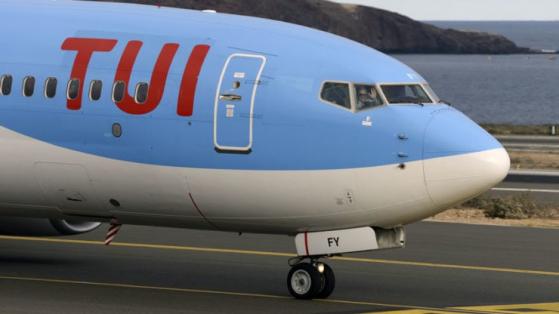
Tui (LON:TUIT)) share price has plunged to a record low, becoming one of the worst-performing stocks in London this year. It has plunged by more than 37% this year, lagging the FTSE 100 and FTSE 250 indices.
Growth is resuming
Tui Group, the biggest European holiday group, is going through significant headwinds even as its business booms. The company has benefited from the rising demand for the tourism industry in the region as most countries reported an increase in tourist arrivals this year.
The most recent results showed that the company’s business is booming. It served over 5.5 million customers while its airline load factor jumped to 93%. Its revenue jumped to €5.3 billion while earnings before interest and tax rose to €169 million.
By segment, its hotels & results EBIT soared to €113 million while cruises and Tui Musement remained flat at €13 million. Most importantly, Tui is working to reduce its total debt as interest rates rise. It reduced its net debt by €1.1 billion to €2.2 billion.
Tui is facing numerous challenges. Like IAG (LON:ICAG) and EasyJet, it is seeing higher costs of doing business as the price of energy jumps. Brent has surged to $93 while the West Texas Intermediate (WTI) has risen to $90.
Tui thrives in a period of low energy prices. For one, it consumes a lot of fuel for its airline and cruise business. Higher energy prices coupled with soaring interest rates have a negative impact on discretionary spending.
Further, Tui has also faced the challenge of flight disruptions and rising competition in the region. Still, I believe that Tui will be able to handle the ongoing headwinds and return to stable profits. Tui is also highly undervalued, trading at a PE multiple of 9.
Tui share price forecast
The daily chart shows that the TUI stock price has been in a strong bearish trend in the past few months. This decline saw it drop to the key support at 493p, the lowest level in May this year. Along the way, the shares have formed an inverted cup and handle pattern. In price action analysis, this pattern is usually a sign that the downtrend will continue.
Tui stock is now forming the handle section of this pattern. It also remains below the 25-day and 50-day moving averages. It has also created a small rising wedge pattern. Therefore, I suspect that the shares will continue facing headwinds in the near term, with the next level to watch being 400p.
The post Tui Group share price forms 2 bearish patterns as headwinds rise appeared first on Invezz.
This article first appeared on Invezz.com
