Benzinga - by Melanie Schaffer, Benzinga Editor.
The SPDR S&P 500 (NYSE: SPY) reached a new all-time high of $526.80 on Wednesday after the Consumer Price Index (CPI) showed inflation pressures eased in April.
The central bank is widely anticipated to hold rates steady until September when a 25-basis point cut is expected. The April reading, which came in broadly in line with estimates has further reinforced that expectation.
Whether or not the SPY will continue its blue-sky run remains to be seen but the ETF is trading in a strong uptrend, making a series of higher highs and higher lows.
Read Next: Asia And Europe Markets Mixed, Copper Hits Two-Year High, Gold Edges Higher At $2,375 - Global Markets Today While US Slept
Trending: Millionaire Trader 'Up 7 Figures In 48 Hours' On GameStop And AMC Meme Coins On Solana
More experienced traders who wish to play the SPY either bullishly or bearishly may choose to do so through one of two Direxion ETFs. Bullish traders can enter a short-term position in Direxion Daily S&P 500 Bull 3X Shares (ARCA: SPXL) and bearish traders can trade the inverse ETF, Direxion Daily S&P 500 Bear 3X Shares (ARCA: SPXS).
The ETFs: SPXL and SPXS are triple leveraged funds that track the movement of the SPY, seeking a return of 300% or –300% on the return of the benchmark index over a single day.
It should be noted that leveraged ETFs are meant to be used as a trading vehicle as opposed to long-term investments
Want direct analysis? Find me in the BZ Pro lounge! Click here for a free trial.
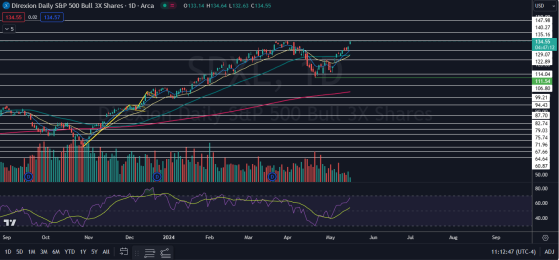
The SPXL Chart: SPXL was rising about 2.23% higher Wednesday after gapping up to start the trading session. The ETF has been trading in an uptrend since April 19, when SPXL found a local bottom at the $111.54 mark.
- The most recent confirmed higher high within the pattern was formed on May 7 at $128.05 and the most recent higher low was printed at the $125.47 mark the following day. On Wednesday, SPXL was working to print a bullish kicker candlestick, which could indicate the ETF will trade higher before finding a local top within the uptrend.
- Bears may choose to wait until the ETF shows signs that a local top has occurred before entering a trade. Bearish traders can watch for SPXL to eventually form a bearish reversal candlestick, such as a doji or shooting star candlestick, which may take place once the ETF has reached overbought territory.
- SPXL has resistance above at $135.16 and at $140.27 and support below at $129.07 and at $122.89.
© 2024 Benzinga.com. Benzinga does not provide investment advice. All rights reserved.
Read the original article on Benzinga
