Benzinga - by The Arora Report, Benzinga Contributor.
To gain an edge, this is what you need to know today.
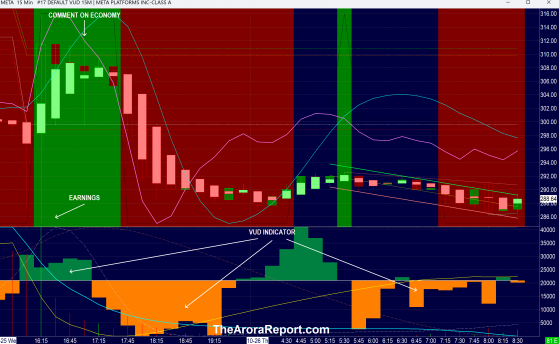
Market Mechanics Please click here for a chart of Meta Platforms Inc (NASDAQ: META).
Note the following:
- The Morning Capsule is about the big picture and not an individual stock. The chart of META is being used to illustrate the point.
- Meta, a very important stock for the stock market, reported earnings after the close. The chart shows when earnings were reported.
- The chart shows that the stock ran up on Meta announcing the strongest profits and sales in its history for the last quarter.
- The chart shows when investors sold META when the company pointed out that Meta is an advertising business and the economic environment is uncertain. As we have shared with you before, advertising goes down in a recession. There is nothing new here. The real reason the stock fell is because of two market mechanics – over-ownership and extremely positive positioning. Market mechanics are powerful. Understanding market mechanics gives you a big edge. Wall Street professionals keep market mechanics close to the chest because of their high value. Fortunately, you have an easy way to learn market mechanics by listening to the podcasts in Arora Ambassador Club.
- As META stock fell, so did stock futures.
- The reaction to Meta earnings in the stock market is an exact repeat of the market reaction to Alphabet earnings that we previously shared with you.
- New data shows that the economy is running hot.
- Q3 GDP-Adv came at 4.9% vs. 4.7% consensus.
- Initial jobless claims came at 210K vs. 210K consensus. Initial jobless claims is a leading indicator and carries heavy weight in our adaptive ZYX Asset Allocation Model with inputs in ten categories. In plain English, adaptiveness means that the model changes itself with market conditions. Please click here to see how this is achieved. One of the reasons behind The Arora Report’s unrivaled performance in both bull and bear markets is the adaptiveness of the model. Most models on Wall Street are static. They work for a while and then stop working when market conditions change.
- Q3 GDP-Adv came at 4.9% vs. 4.7% consensus.
- Durable orders also indicate a hot economy. Here are the details:
- Durable orders came at 4.7% vs. 1.5% consensus.
- Durable orders ex-transport came at 0.5% vs. 0.3% consensus.
- Stock futures were sold after Meta earnings, and there was more selling earlier this morning. After the release of economic data showing a stronger economy, the momo crowd aggressively started buying stocks. Prudent investors should note a change in the momo crowd behavior. Usually, the momo crowd buys on weak economic data because it means to them that the Fed will lower interest rates. Historically, the momo crowd sells on strong economic data. However, today, they are buying on strong economic data.
- In The Arora Report analysis, the unusual momo crowd behavior today is due to the market falling to a support zone.
- As an actionable item, the sum total of the foregoing is in the protection band, which strikes the optimum balance between various crosscurrents. Please scroll down to see the protection band.
In the early trade, money flows are negative in Apple Inc (NASDAQ: AAPL), Amazon.com, Inc. (NASDAQ: AMZN), Alphabet Inc Class C (NASDAQ: GOOG), Microsoft Corp (NASDAQ: MSFT), NVIDIA Corp (NASDAQ: NVDA), and Tesla Inc (NASDAQ: TSLA).
In the early trade, money flows are mixed in SPDR S&P 500 ETF Trust (ARCA:SPY) and Invesco QQQ Trust Series 1 (NASDAQ: QQQ).
Momo Crowd And Smart Money In Stocks The momo crowd is buying stocks in the early trade. Smart money is