Benzinga - by The Arora Report, Benzinga Contributor.
To gain an edge, this is what you need to know today.
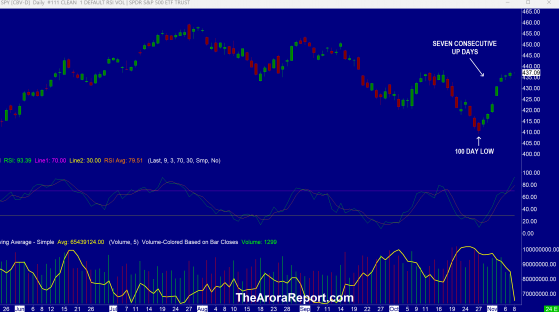
Know The Reason Behind The Indicators Please click here for a chart of SPDR S&P 500 ETF Trust (ARCA:SPY) which represents the benchmark stock market index S&P 500 (SPX).
Note the following:
- The chart shows a bullish pattern that has not been seen since March 2003.
- The chart shows the 100 day low.
- The chart shows seven consecutive days up. The bullish pattern is seven consecutive up days after a 100 day low.
- March 2003 marked the end of a bear market. History does not exactly repeat itself, but it is worth paying attention to.
- The difference from 2003 is that this time the pattern in the stock market resulted from a massive short squeeze in bonds. Patterns are more reliable when they are not based on market mechanics. Thank you for your requests for a podcast on this epic move in the stock market and the underlying market mechanics. We are working on a podcast that will be available in Arora Ambassador Club.
- RSI on the chart shows that the market is overbought. Overbought markets tend to be vulnerable to the downside.
- Powell speaks today. Powell is expected to try to cool down the rampant speculation in the stock market of interest rate cuts coming soon.
- Expect momo gurus to use two narratives to persuade their followers to continue to aggressively buy stocks: fight the Fed and do not believe Powell.
- Zweig Breadth Thrust Indicator completed last Friday. It is gaining popularity this week as a reason to buy stocks. This indicator has triggered 18 times since 1945 and has been correct 100% of the time. It predicts a return of about 25% over the next 11 months.
- In The Arora Report analysis, investors need to look not only at the breadth and patterns but the reasons behind the patterns. Here, the reason was a massive short squeeze in the bond market. Short squeezes tend to end. As we shared with you yesterday:
In The Arora Report analysis, the first leg of the short squeeze in bonds is now over.
- Yields had risen because of the massive upcoming supply of Treasuries due to excessive government spending. This reason is still there. The Arora Report was one of the first to alert investors of the massive upcoming Treasury borrowing. Subsequently, we shared with you:
From October to December, the Treasury will borrow $776B. In The Arora Report analysis, this amount is $76B less than the consensus.
- The Treasury is still going to borrow a massive amount. We also previously wrote:
That is $1.592T of borrowing over six months.
- As an actionable item, the sum total of the foregoing is in the protection band, which strikes the optimum balance between various crosscurrents. Please scroll down to see the protection band.
In the early trade, money flows are mixed in SPDR S&P 500 ETF Trust (ARCA:SPY) and Invesco QQQ Trust Series 1 (NASDAQ: QQQ).
Momo Crowd And Smart Money In Stocks The momo crowd is buying stocks in the early trade. Smart money is