Benzinga - by Benzinga Insights, Benzinga Staff Writer.
In today's rapidly changing and highly competitive business world, it is vital for investors and industry enthusiasts to carefully assess companies. In this article, we will perform a comprehensive industry comparison, evaluating Costco Wholesale (NASDAQ:COST) against its key competitors in the Food & Staples Retailing industry. By analyzing important financial metrics, market position, and growth prospects, we aim to provide valuable insights for investors and shed light on company's performance within the industry.
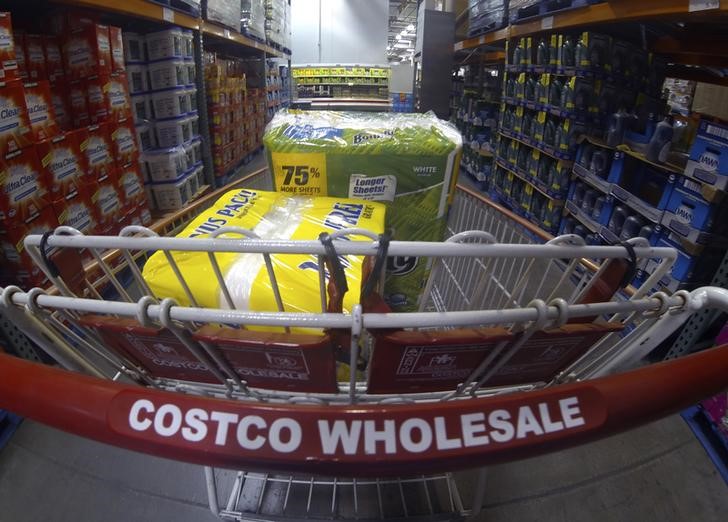
Costco Wholesale Background Costco operates a membership-based, no-frills retail model, predicated on offering a select product assortment in bulk quantities at bargain prices. The firm avoids maintaining costly product displays by keeping inventory on pallets and limits distribution expenses by storing its inventory at point of sale in the warehouse. Given Costco's frugal cost structure, the firm is able to price its merchandise below competing retailers, driving high sales volume per warehouse and allowing the retailer to generate strong profits on thin margins. Costco operates 591 warehouses in the United States and boasts over 60% market share in the domestic warehouse club industry. Internationally, Costco operates another 270 warehouses, primarily in markets such as Canada, Mexico, Japan, and the U.K.
CompanyP/EP/BP/SROEEBITDA (in billions)Gross Profit (in billions)Revenue Growth| Costco Wholesale Corp | 39.78 | 9.95 | 1.03 | 8.88% | $3.71 | $9.72 | 9.5% |
| Walmart Inc | 31.52 | 5.55 | 0.70 | 10.39% | $14.27 | $39.78 | 5.74% |
| Target Corp | 14.65 | 4.11 | 0.46 | 7.08% | $1.9 | $6.97 | -4.85% |
| Dollar General Corp | 12.09 | 4.11 | 0.68 | 7.67% | $0.9 | $3.04 | 3.93% |
| Dollar Tree Inc | 20.66 | 2.77 | 0.86 | 2.24% | $0.49 | $2.14 | 8.23% |
| BJ's Wholesale Club Holdings Inc | 18.05 | 7.31 | 0.47 | 11.12% | $0.26 | $0.9 | -2.75% |
| Sendas Distribuidora SA | 20.34 | 3.85 | 0.26 | 4.38% | $1.36 | $2.76 | 22.92% |
| Pricesmart Inc | 18.75 | 1.79 | 0.46 | 1.38% | $0.05 | $0.19 | 9.48% |
| Almacenes Exito SA | 410.91 | 0.69 | 0.21 | -0.1% | $306.87 | $1339.43 | 8.52% |
| Average | 68.37 | 3.77 | 0.51 | 5.52% | $40.76 | $174.4 | 6.4% |
th, td { padding: 8px; text-align: left; }
th { background-color: #293a5a; color: #fff; text-align: left; }
tr:nth-child(even) { background-color: #f2f4f8; }
tr:hover { background-color: #e1e4ea; }
td:nth-child(3), td:nth-child(5) { text-align: left; }
.dividend-amount { font-weight: bold; color: #0d6efd; }
.dividend-frequency { font-size: 12px; color: #6c757d; } By closely examining Costco Wholesale, we can identify the following trends:
- The stock's Price to Earnings ratio of 39.78 is lower than the industry average by 0.58x, suggesting potential value in the eyes of market participants.
- It could be trading at a premium in relation to its book value, as indicated by its Price to Book ratio of 9.95 which exceeds the industry average by 2.64x.
- With a relatively high Price to Sales ratio of 1.03, which is 2.02x the industry average, the stock might be considered overvalued based on sales performance.
- With a Return on Equity (ROE) of 8.88% that is 3.36% above the industry average, it appears that the company exhibits efficient use of equity to generate profits.
- The Earnings Before Interest, Taxes, Depreciation, and Amortization (EBITDA) of $3.71 Billion is 0.09x below the industry average, suggesting potential lower profitability or financial challenges.
- Compared to its industry, the company has lower gross profit of $9.72 Billion, which indicates 0.06x below the industry average, potentially indicating lower revenue after accounting for production costs.
- The company's revenue growth of 9.5% exceeds the industry average of 6.4%, indicating strong sales performance and market outperformance.
The debt-to-equity (D/E) ratio indicates the proportion of debt and equity used by a company to finance its assets and operations.
Considering the debt-to-equity ratio in industry comparisons allows for a concise evaluation of a company's financial health and risk profile, aiding in informed decision-making.
When comparing Costco Wholesale with its top 4 peers based on the Debt-to-Equity ratio, the following insights can be observed:
- When considering the debt-to-equity ratio, Costco Wholesale exhibits a stronger financial position compared to its top 4 peers.
- This indicates that the company has a favorable balance between debt and equity, with a lower debt-to-equity ratio of 0.35, which can be perceived as a positive aspect by investors.
This article was generated by Benzinga's automated content engine and reviewed by an editor.
© 2023 Benzinga.com. Benzinga does not provide investment advice. All rights reserved.