Benzinga - by Piero Cingari, Benzinga Staff Writer. The U.S. housing market is facing a seismic shock. Mortgage rates skyrocket to levels not seen in over two decades.
The average contract interest rate for 30-year fixed-rate mortgages has surged by 15 basis points (bps). The rates reached a staggering 7.31% for the week ending Aug. 18. This marks the highest rate since December 2000, according to data released by the Mortgage Bankers Association of America (MBA).
Treasury Yield Surge Fuels Surge In Mortgage Rates The surge in mortgage rates is intrinsically linked to the recent surge in long-term Treasury yields.
“Treasury yields continued to spike last week as markets grappled with illiquidity and concerns that the resilient economy will keep inflation stubbornly high,” said Joel Kan, an MBA economist,
As 10-year benchmark yields breach 3.3%, the loftiest point since November 2007. The 30-year Treasury yield crossed 3.4%, reaching heights unseen since May 2011, and the broader market is contending with heightened “risk-free” rates. These rates, acting as a gravitational force, are pulling the entire spectrum of interest rates.
Read Also: Risk-Free 10-Year Bond Promises 53% Gain – Stocks Brace For Impact
This trend is propelled by higher-than-expected issuances and hawkish comments from the Federal Reserve. The yield surge has also pushed real yields on Treasury-inflation-protected securities (TIPS) to their highest levels since 2009. This further complicates the economic landscape.
U.S. Homebuyers Grapple with Unforeseen Challenges As the real estate market navigates these uncharted waters, U.S. homebuyers find themselves facing an unexpected challenge.
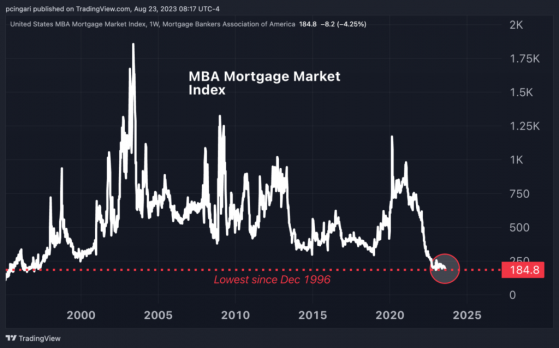
Mortgage applications have plummeted by 4.2% in the week ending Aug. 18, the fifth consecutive week of decline.
Requests for home loan refinancing have slipped by 2.8%, while applications for new home purchases have seen a considerable drop of 5%.
- The MBA Mortgage Market Index, a key gauge of mortgage application trends, has taken a significant hit, falling by 4.1% to a score of 184.8 points. This level hasn’t been observed since December 1996, a testament to the gravity of the situation.
- The Real Estate Select Sector SPDR Fund (NYSE:XLRE) has posted five negative weeks out of the past six, and is down 18% when compared to a year ago.
All Eyes On Jackson Hole The Jackson Hole Symposium, hosted by the Federal Reserve this week, is anticipated to provide clarity on the economic horizon and shed light on the path that interest rates might take.
Investors and industry stakeholders await with bated breath to hear from Fed Chair Jerome Powell, whose speech is scheduled this Friday.
Read now: Jackson Hole Fed Symposium 2023: What Should Investors Anticipate From Powell’s Address?
© 2023 Benzinga.com. Benzinga does not provide investment advice. All rights reserved.
Read the original article on Benzinga
