Benzinga - by Piero Cingari, Benzinga Staff Writer.
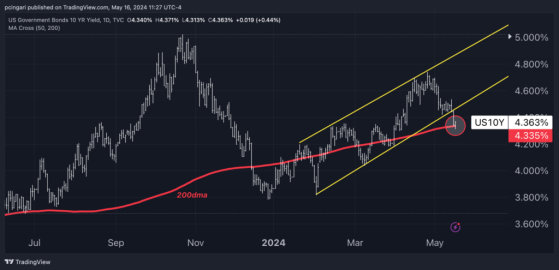
A major trend shift is unfolding in the bond market, as key Treasury yields are currently testing the support of the crucial 200-day moving average, following the release of benign economic data that has cemented investor bets on Federal Reserve rate cuts.
Last month, the inflation rate calculated using the consumer price index (CPI) came in at 3.4% compared to the same month last year, down from 3.5% in March, and in line with the forecasted 3.4% increase. The “core” inflation rate, which excludes volatile energy and food prices, also matched estimates, falling from 3.8% to 3.6%.
April's inflation reading has raised hopes that the disinflation trend may restart after three consecutive higher-than-predicted CPI readings in the first quarter.
In his recent comments, Federal Reserve Chair Jerome Powell downplayed concerns about a possible hike in interest rates, signaling that the next adjustment would likely be a reduction. However, he emphasized this cut might come later than the markets initially anticipated.
Money markets are currently factoring in a 50 basis point reduction in interest rates by the end of the year, with a 70% chance for the Federal Reserve to begin its loosening cycle in September.
Treasury Yields Eye 200-Day Moving Average Support The yield on the benchmark 10-year Treasury note traded at around 3.36% on Thursday, hitting an intraday low of 3.31%, temporarily sliding below the 200-day average positioned at 3.33%.
Similarly, yields on both 2-year and 30-year Treasury notes are currently testing the support of the 200-day average.
The 200-day moving average is a widely watched technical indicator that helps investors gauge the long-term trend of a security or index.
When Treasury yields fall below this level, it often signals a bearish or downward trend, suggesting that investors are seeking safer assets amid expectations of a slowing economy or lower interest rates. This shift can create a more favorable environment for bond prices, which move inversely to yields.
Here’s a snapshot of the current yield levels compared to their 200-day moving averages, as well as their 2024 high-to-low range.
| 2 year | 4.78% | 4.75% | 5.05% | 4.12% |
| 5 year | 4.39% | 4.35% | 4.75% | 3.75% |
| 10 year | 4.36% | 4.33% | 4.74% | 3.82% |
| 30 year | 4.50% | 4.48% | 4.85% | 4.07% |
Chart: Inflation Data Casts Doubt On 10-Year Treasury Yield’s 2024 Rising Trend
Read Also: US Inflation Data Prematurely Released By Accident, Yet Traders Missed Golden Opportunity
Bond ETFs Set To Rally The shift in Treasury yields has set the stage for a rally in bond ETFs, especially those focused on long-duration bonds.
Here are five bond ETFs poised to benefit from rising expectations of Fed rate cuts:
Photo: Shutterstock
© 2024 Benzinga.com. Benzinga does not provide investment advice. All rights reserved.
Read the original article on Benzinga
