(Bloomberg Opinion) -- Imagine if you could predict recessions, years in advance, more accurately than professional economic forecasters, just by looking at a few data points. Well, according to a 2008 paper by economists Glenn Rudebusch and John Williams, you can.
The data you have to look at is what's known as the yield curve -- a technical term for the different interest rates on government bonds of various maturities. Here’s what those interest rates look like right now:
You’ll notice that the curve slopes upward to the right, meaning that longer-maturity bonds pay higher interest rates than shorter-maturity bonds. That’s typical. The most likely reason is that short-maturity bonds are more liquid -- it’s easier to get your money out quickly without being exposed to the risk of a market downturn.
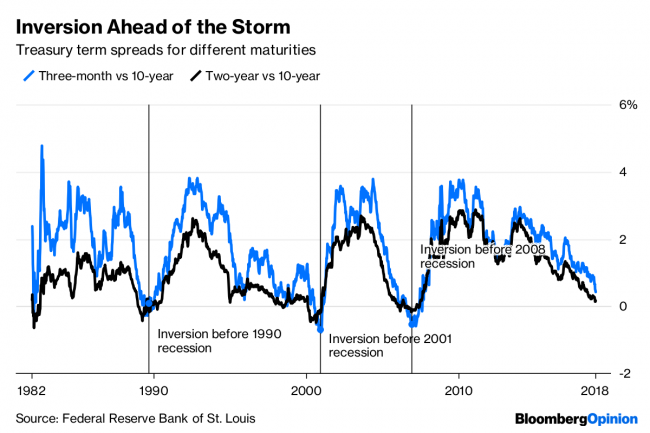
But sometimes, this relationship changes. When short-term rates are higher than long-term rates, the yield curve is said to have inverted. A recession tends to follow in the next couple of years. For example, here are two different measures of the term spread, or the difference between short-term and long-term rates:
As you can see, the yield curve inverted in 1989, in 2000 and in 2006. Recessions occurred in 1990, 2001 and 2008.
Somehow, Rudebusch and Williams find, economic forecasters often fail to pay attention to this seemingly reliable indicator. They find that recession probability forecasts based on the Survey of Professional Forecasters are less accurate than forecasts based on the term spread between three-month and 10-year Treasuries with horizons of more than one calendar quarter. In other words, simply looking at one piece of the yield curve would let you beat the pros. The onset of the Great Recession in December 2007, 22 months after the term spread went negative, seems to confirm the pattern.
Why do inverted yield curves tend to predict recessions? When short-term rates are higher than long-term rates, it means that bond markets expect short-term rates to fall soon. That’s what happens in a recession, as the Federal Reserve cuts rates in an attempt to stimulate investment and consumption. So the fact that the yield curve forecasts recessions better than the pros just means that markets tend to be better aggregators of information than even highly trained individuals -- a result that tends to hold in many domains.
Of course, even the yield curve isn’t all-knowing. The spread between two-year and 10-year Treasuries briefly dipped below zero in June 1998, but that expansion wasn’t quite ready to quit. In late 1994, the spread narrowed to just 15 basis points, and for much of 1995 the spread between three-month and 10-year Treasuries was less than 1 percent. But betting on a recession in 1996 or 1997 would have been a huge mistake.
Nevertheless, the yield looks like one of the most reliable harbingers of recession that we have (the other is the share of risky corporate debt). And that warning sign is now flashing yellow. In December 2013, as the U.S. economic recovery really started to find its footing, the difference between three-month and 10-yearTreasury yields was 2.97 percent. In December 2016, after Donald Trump’s election, it was 1.94 percent. But as of last month, it was down to only 0.36 percent. That would be less worrying if the term spread had bounced around and just happened to be at a low point. But the trend has shown a steady narrowing. If it continues on its current path, the spread will go negative in a few months.
Why is the yield curve close to inverting? It’s hard to tell whether it’s because economic conditions are deteriorating -- perhaps because of President Donald Trump’s trade war and erratic policies, or over-borrowing by corporations -- or if the Fed’s interest rate hikes are putting the expansion in unnecessary danger.
Looking back at the history of interest rates, it seems like the yield curve inverts when the Fed raises short-term rates and long-term rates don’t rise to match:
That suggests -- though it doesn’t prove -- that Fed rate hikes trigger the end of expansions. That doesn’t mean the Fed is making a mistake by raising rates. It might be that stresses build up naturally in the system, because of bad investments and ill-advised borrowing by companies or consumers, such that even small rate hikes are enough to put an end to the party. That would be consistent with theories of the leverage cycle and of financial instability. If so, the Fed’s hands are basically tied -- unless it keeps rates at zero forever, it will eventually be seen as the culprit in a recession.
But in the current economic environment, rate hikes seem like a bad idea. Core inflation shows little sign of accelerating in recent months:
With inflation in check, and the yield curve close to inversion, it makes sense not to raise rates further for the time being.