Get 40% Off
🤯 This Tech Portfolio is up 29% YTD! Join Now to Get April’s Top PicksGet The Picks – Just 99 USD

Valuation of Asian shares rises to 11-year high

Published 09/09/2020, 12:24
Updated 09/09/2020, 12:30
© Reuters. FILE PHOTO: A man wearing protective face mask walks in front of a stock quotation board outside a brokerage in Tokyo

© Reuters. FILE PHOTO: A man wearing protective face mask walks in front of a stock quotation board outside a brokerage in Tokyo

(Reuters) - The valuation of Asian shares surged to a near 11-year high in August, Refinitiv data showed, thanks to an increase in global liquidity and emerging signs of economic recovery in some parts of the region.

The forward 12-month price-to-earnings ratio (P/E) for MSCI's broadest index of Asia-Pacific shares (MIAP00000PUS) was 16.71 last month, the highest since October 2009. The index itself gained 4.9% in August and hit a two-year high.

That was still less than the P/E ratio of 20.15 for MSCI's global stock index (MIWD00000PUS), which gained 6% last month.

Analysts said surveys showing Chinese factory activity expanded at the fastest rate in nearly a decade in August had boosted Asian shares last month.

India and Australia shares were the most expensive in the region with P/E ratios of 20.68 and 17.4 respectively.

Graphic: Valuations of Asian-Pacific equities - https://fingfx.thomsonreuters.com/gfx/mkt/xegvbowlzpq/Valuations%20of%20Asian-Pacific%20equities.jpg

Graphic: MSCI Asia and World index's PE - https://fingfx.thomsonreuters.com/gfx/mkt/xklvynobepg/MSCI%20Asia%20and%20World%20index%20PE.jpg

Amish Shah, India equity strategist at Bofa Securities, said India's valuation premium to other emerging markets of 50% was still less than its all-time peak of 73%.

"Lower premium to some extent reflects the risk of high (coronavirus) infections impacting economic growth near term. That said, we do believe that the markets would consolidate in the near term since large sectors such as IT, Telecom, Pharma now offer limited scope for further upside," he added.

China and Hong Kong shares were the cheapest in the regions with P/E ratios at 11.24 and 11.67.

Graphic: Asia-Pacific equities performance in 2020 - https://fingfx.thomsonreuters.com/gfx/mkt/xlbpgldwavq/Asia-Pacific%20equities%20performance%20in%202020.jpg

Graphic: Asia-Pacific equities performance in August 2020 - https://fingfx.thomsonreuters.com/gfx/mkt/rlgpdoexdvo/Asia%20Pacific%20equities%20performance%20in%20August%202020.jpg
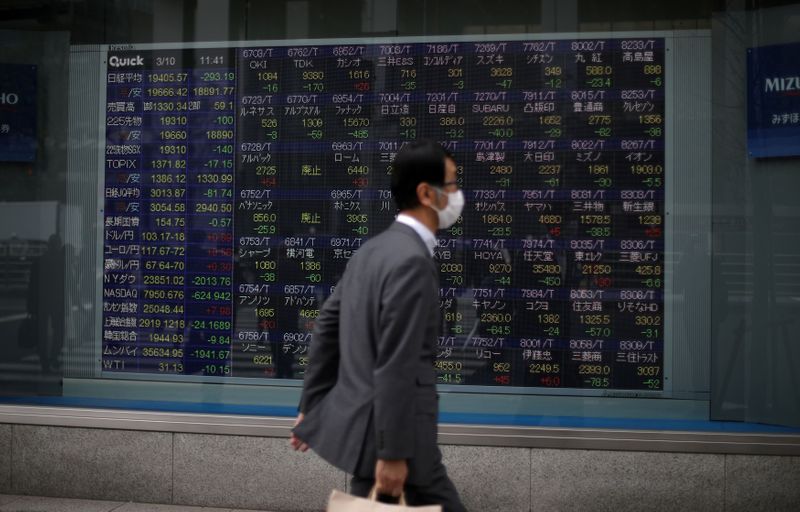
© Reuters. FILE PHOTO: A man wearing protective face mask walks in front of a stock quotation board outside a brokerage in Tokyo

Latest comments

Risk Disclosure: Trading in financial instruments and/or cryptocurrencies involves high risks including the risk of losing some, or all, of your investment amount, and may not be suitable for all investors. Prices of cryptocurrencies are extremely volatile and may be affected by external factors such as financial, regulatory or political events. Trading on margin increases the financial risks.
Before deciding to trade in financial instrument or cryptocurrencies you should be fully informed of the risks and costs associated with trading the financial markets, carefully consider your investment objectives, level of experience, and risk appetite, and seek professional advice where needed.
Fusion Media would like to remind you that the data contained in this website is not necessarily real-time nor accurate. The data and prices on the website are not necessarily provided by any market or exchange, but may be provided by market makers, and so prices may not be accurate and may differ from the actual price at any given market, meaning prices are indicative and not appropriate for trading purposes. Fusion Media and any provider of the data contained in this website will not accept liability for any loss or damage as a result of your trading, or your reliance on the information contained within this website.
It is prohibited to use, store, reproduce, display, modify, transmit or distribute the data contained in this website without the explicit prior written permission of Fusion Media and/or the data provider. All intellectual property rights are reserved by the providers and/or the exchange providing the data contained in this website.
Fusion Media may be compensated by the advertisers that appear on the website, based on your interaction with the advertisements or advertisers.
© 2007-2024 - Fusion Media Limited. All Rights Reserved.