YOC’s FY21 preliminary results were at the top end of December guidance, which was an uplift from the guidance it gave with its H121 results. VIS.X, its programmatic advertising platform, continues to be the primary growth driver, contributing to both the doubling of the group’s trading volume and margin expansion throughout FY21. YOC benefited from a strong Q421, which is typically its strongest quarter due to seasonal effects. Its balance sheet strengthened throughout the year and we anticipate robust free cash flow should support its transition into a positive equity position in FY22.
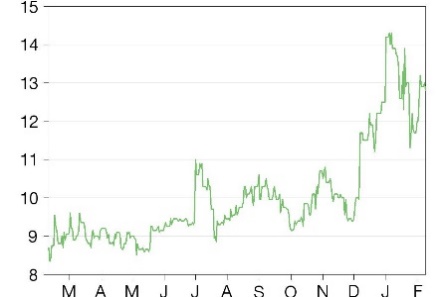
Share price graph

Business description
YOC is a Germany-based technology company that develops software for the global digital advertising market. By using the platform VIS.X and YOC's proprietary ad formats, advertisers can increase awareness for their brand or products in combination with high-quality advertising inventory. Its supply-side platform VIS.X, launched in 2018, provides a programmatic marketplace for the automatic trading of digital advertising units, allowing for the real-time bidding of advertising budgets. YOC’s key markets include Germany, Austria and Poland.
Further dynamic growth and profitability expected
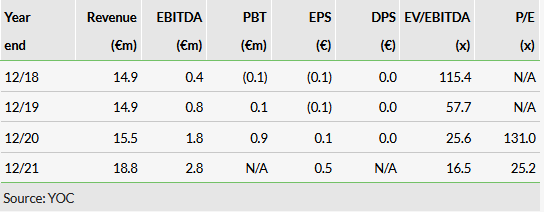
YOC’s FY21 revenue grew 22% y-o-y to €18.8m, which was at the top end of management’s December guidance of €18.5–19m. This range represented an uplift from the guidance given in its H121 results of €17–18m, reflecting the success of its VIS.X strategy and high-impact ad formats (discussed in our December flash). FY21 performance also benefited from a strong Q4, where sales increased by 26% yoy to €7.2m. Q4 is typically YOC’s and most marketing service companies’ strongest quarter due to seasonal effects. FY21 EBITDA improved by 56% y-o-y to €2.8m (guidance of €2.5–2.8m), equating to a year-on-year margin expansion of 3pp to 15%. This reflects the stronger operating leverage of its VIS.X strategy compared to traditional selling methods, where automation allows for more transactions to be completed on the platform without the need to scale manpower. Net income was up fivefold year-on-year to €1.8m, but we note that FY20 net income was negatively affected by YOC’s discontinued operations in Spain. Management believes momentum will continue into FY22, which we believe will be supported by its expansion into the Swiss market through its theINDUSTRY acquisition.
Positioning itself well for FY22
YOC’s balance sheet strengthened throughout the year, benefiting from profit growth and c €1.6m of free cash flow (FCF) generation. In our initiation, we noted that high levels of FCF and profitability would be key for YOC moving to a positive equity position, which we believe could happen in FY22. We expect that its net debt figure will have fallen significantly during the year, reflecting the conversion of its convertible bond in H121 and €0.7m of financial liabilities repayments in FY21.
Valuation: Discount narrowing
Across FY21 sales and EBITDA, YOC trades at EV multiples of 3x and 17x, discounts of 55% and 5% respectively to our peer group. We note that the discount has closed considerably from the discounts our November QV. We see further upside potential in FY22 given the positive momentum in revenues and profits.
Historic financials (no consensus forecasts available)

