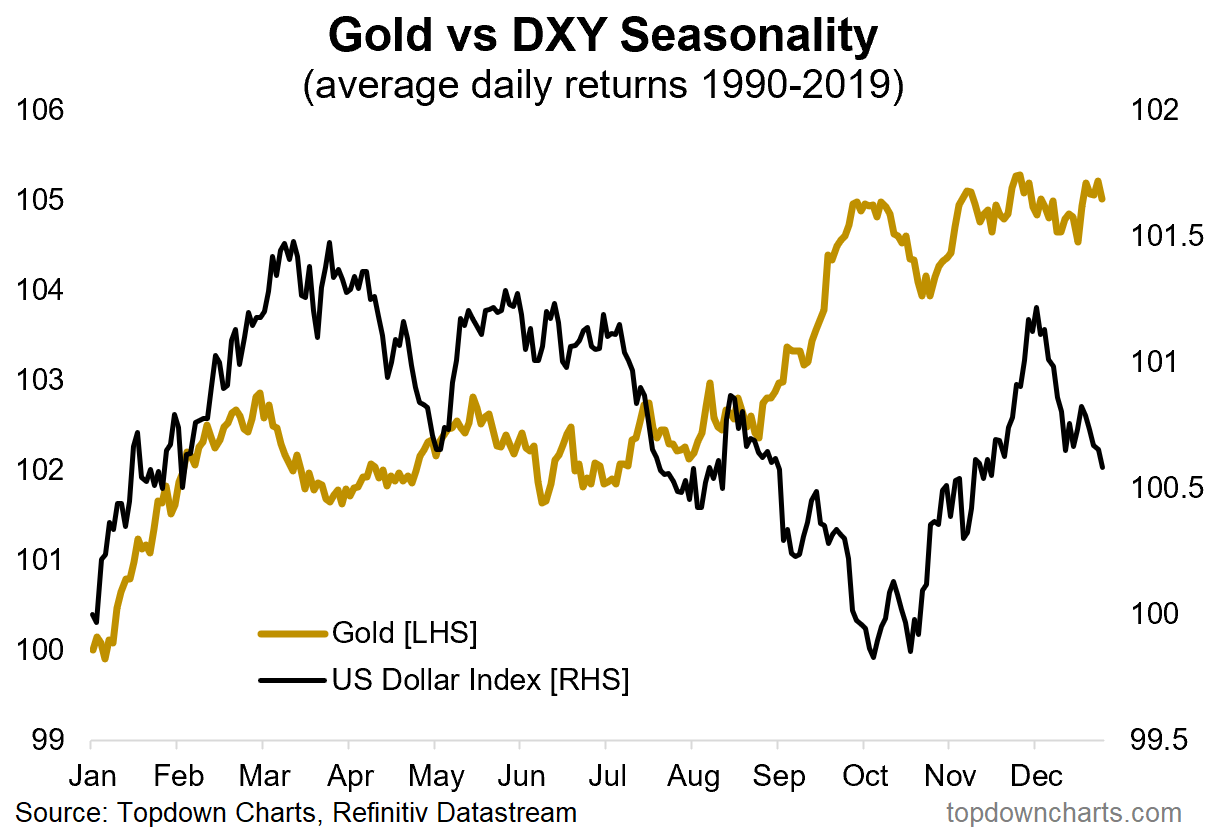
Seasonal trends are often used by investors to give an indication of where prices may move next. Take the example of gold. The middle of the year tends to mark an inflection point between gold and the US Dollar. The chart below illustrates that the period between June and October is usually very strong for gold prices, at the expense of US dollar weakness. At other times of the year gold and the dollar broadly move in the same direction.
There is a good reason why prices might move higher towards September and October. Diwali (also known as the Festival of Lights) is a major shopping season in late October or early November. Families typically splash out on gold jewellery. Merchants and jewellers purchase gold during the third quarter of the year in anticipation of a surge in demand .
However, talk of a consistent seasonal pattern in the price of any financial asset should always be viewed with suspicion. Seasonal tendencies are just that – tendencies. The existence of such a pattern (at least where the price swing is substantial) would imply that the market is so inefficient that some participants would be able to profit at the expense of others simply by following the calendar.
For example, the seasonal drivers of the demand for gold are hardly a secret. Hence, there cannot be many market participants who are not aware of this. The physical characteristics that make gold a popular store of value also make it easier to hold stocks to arbitrage away any seasonal price patterns. Above all, gold is durable (not like foodstuffs) and it has a high value-to-volume ratio (in contrast to oil). Meanwhile, there is also a large amount of old (scrap) gold that can come back on to the market. Gold is fungible in the sense that because of its high durability refined gold is considered identical with scrap gold.
Seasonal patterns can also be heavily influenced by the events of one or more extreme event. For example, the plunge in oil prices during March and April 2020 was clearly exceptional, but so was their rebound during the subsequent two months. The collapse of Lehman Brothers in September 2008 set off a chain of events that led to a dramatic decline in industrial and energy prices. Meanwhile, an especially bad monsoon event in India (such as that which occurred in 2019) could lead to slow physical demand for gold from the country’s farmers.
Rare events are not typical seasonal events, yet their legacy lives on in charts showing average returns over time. Seasonal trends are also affected by selection bias resulting from the time period which is analysed. Average monthly returns during the bull market of a commodity super-cycle might look very different from the slow, painful decline exhibited during a bear market.
So take seasonal patterns with a pinch of salt. Taken together with other evidence (technical, fundamental, positioning and sentiment) seasonality could be used to support a short term bullish or bearish investment case. Nevertheless, relying on seasonality alone to guide your investment decisions is like turning up at a beach in Britain, during peak summer season and expecting it to be nice, because on average it’s warm and sunny. You are likely to be disappointed.
Related article: Indian gold: Why the monsoon season plays a crucial role in driving gold demand
