This article was written exclusively for Investing.com
- Commodities rising to new highs daily
- Gold lagging other precious metals
- Gold is resting, consolidating, and preparing for its next move to the upside
- Three reasons why a rally is on the horizon
- Use weakness as a buying opportunity; GDXJ could turbocharge the next rally
Gold holds a special and unique place in the world financial system. The yellow metal is a commodity with industrial applications. It is also a currency. Central banks, monetary authorities, and governments hold the precious metal as an integral part of foreign currency reserves.
Long before there were dollars, euros, pounds, yen, yuan, or any other currencies circulating through the worldwide financial system, gold was money. Gold has a prominent place in the Bible’s old testament. Archeological evidence points to gold’s role in ancient economies.
Every ounce of gold that has come from the earth’s crust continues to exist in some form. Gold is eternal. In 2020, the price rose to a modern-day high of $2063 per ounce. At the turn of this century, gold traded below the $300 level. With gold sitting below the $1740 level at the end of last week, some market participants say that gold’s best days are in the past.
However, you should not count out this precious metal which has a long history as a store of value. Gold is resting, and it is likely to surprise over the coming months and years. The two-decade trend in the gold futures market is higher. The current environment continues to support higher lows and higher highs.
Gold mining shares tend to provide leverage to the price action in the gold market. They underperform the metal when its price falls and outperform during periods when the commodity appreciates. Junior gold mining stocks tend to offer even more gearing than the more established producers as they explore for the metal. The VanEck Vectors Junior Gold Miners ETF (NYSE:GDXJ) holds a diversified portfolio of junior gold mining stocks.
Commodities rising to new highs daily
Over the past weeks and months, raw material prices have been rising to multi-year, and in some cases, all-time highs. Last week, copper rose to over $4.37 per pound, the highest level for the red metal since 2011 and only around 6% below its all-time high at $4.6495.
Lumber traded to a record high of over $1030 per 1,000 board feet on Feb. 23. Grain and oilseed futures recently rose to over six-year highs. Cotton moved to its highest price since June 2018 and sugar futures since March 2017.
In February, platinum broke out above its technical resistance level at the August 2016, $1199.50 high, reaching a peak at $1348.20 on Feb. 16, the highest price for the precious metal since September 2014, before correcting. Crude oil was above $61 per barrel at the end of last week and on its way to a potential test of the 2020, $65.65 per barrel high on the nearby NYMEX futures contract.
The commodities asset class continues to exhibit all the hallmarks of a bullish secular trend as we head into March 2021.
Gold lagging other precious metals
Gold was one of the first markets to reach a new record high in 2020. 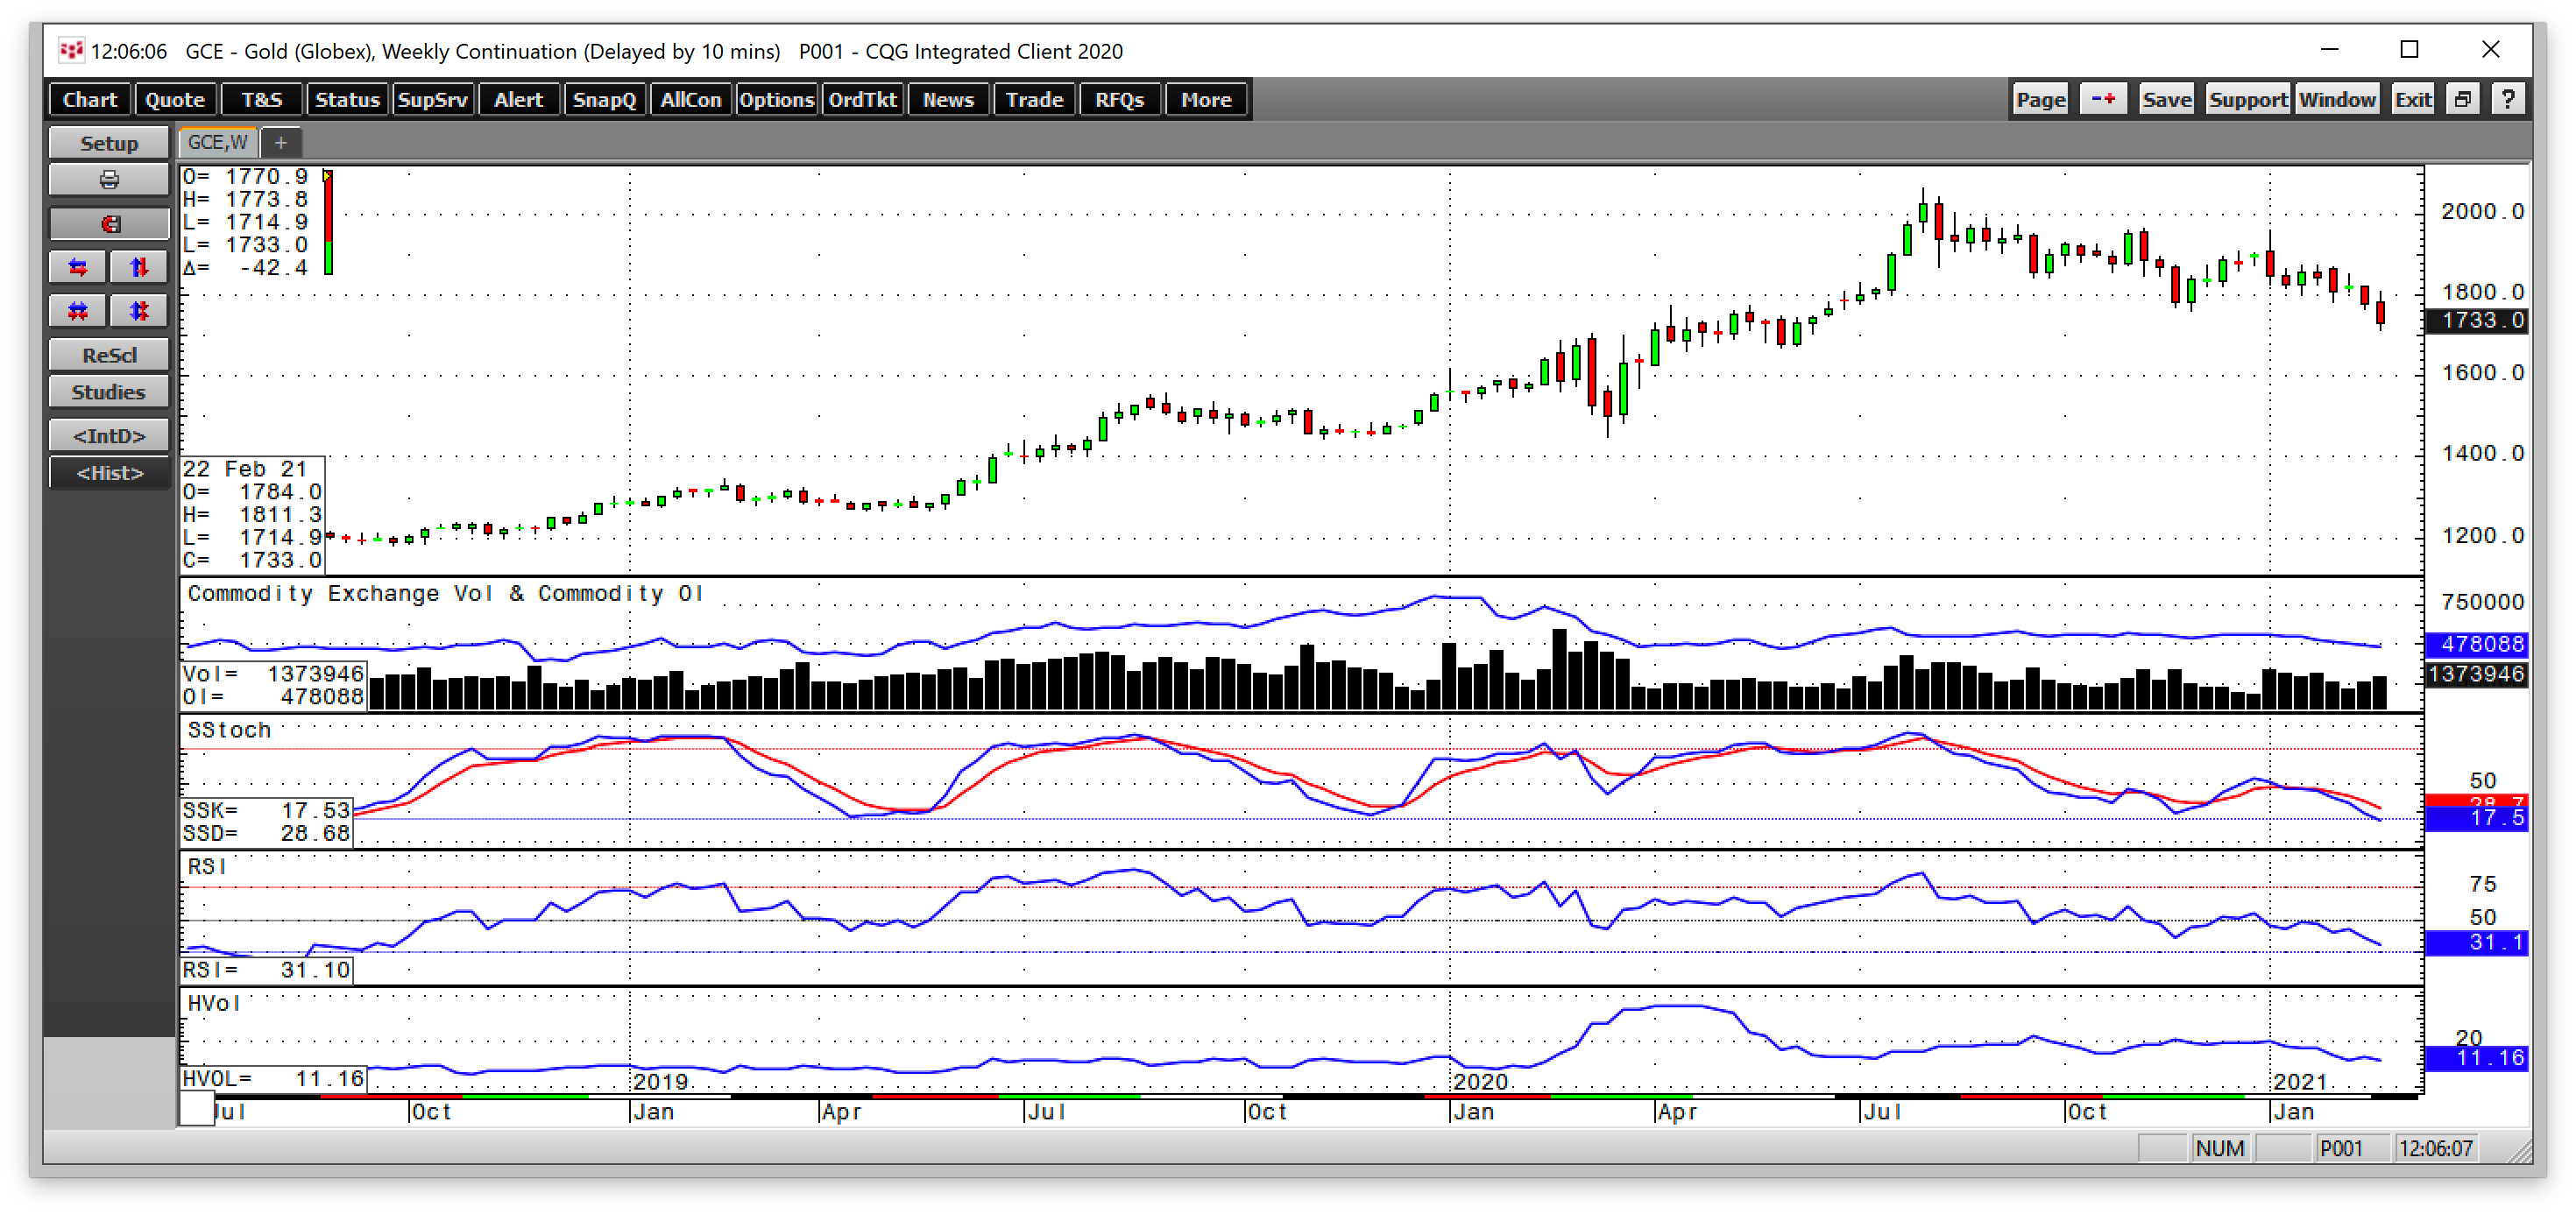
Source: CQG
As the weekly chart highlights, gold hit a high of $2063 per ounce in early August 2020. Since then, gold has made lower highs and lower lows.
Open interest, the total number of open long and short positions in the COMEX gold futures market declined from over 550,000 contracts when gold was at its peak to 478,088 contracts at the end of last week. The over 13% decline in the metric as the price corrects is not typically a technical validation of an emerging bearish trend in a futures market.
Meanwhile, price momentum and relative strength indicators have declined from overbought conditions in August to oversold readings at the end of February. Weekly historical volatitity dropped from over 17.5% in August to just above 11% as of Feb. 26.
Gold is resting, consolidating, and preparing for its next move to the upside
Nearby April COMEX gold futures settled at the $1728.80 level at the end of February, 16.2% below the August 2020 record peak. From a long-term perspective, gold broke out above its critical technical resistance level at the July 2016, $1377.50 high in mid-2019 and continued to move higher until last August.
The midpoint of the breakpoint and all-time high stands at $1720.25 per ounce, just a few bucks below the Feb. 26 closing level. The low since last August occurred last week at $1714.90, as the precious metal closed the second month of 2021 at its lowest level since June 2020.
Gold is a unique asset. It has roles as a commodity and a currency.
Commodities often experience high volatility levels while currencies are just the opposite. However, like commodities, gold is ultimately sensitive to rising inflationary pressures. I view the current price weakness and consolidation in the gold market as constructive, as the precious metal digests last summer’s record high. I have been trading gold over the past four decades and have found when the market becomes overly bullish it often signals a correction. Rising bearish sentiment often precedes a bottom.
The spectacular rise in Bitcoin and other digital currencies has caused many market participants to flock to those assets. More than a few analysts cite Bitcoin’s utility compared to gold and suggest that the cryptocurrency will replace the yellow metal.
However, the parabolic price action could be just the factor that ignites the next rally in the gold market. When gravity hits the cryptos, the flight back to gold could push the precious metal to new record highs.
Three reasons why a rally is on the horizon
Gold has a long history as an inflation barometer. Central bank liquidity and government stimulus programs have dramatically increased the money supply and deficits over the past year. While the 2008 global financial crisis and the 2020 worldwide pandemic were very different events, monetary and fiscal policy responses were similar.
The only difference is that in 2020, the level of liquidity and stimulus was far higher. From June through September 2008, the US Treasury borrowed a record $530 billion to fund the stimulus. In May 2020, it borrowed $3 trillion. The US deficit is fast approaching the $28 trillion level. The next stimulus program is likely to push it over $30 trillion. The price tag for policies that encourage borrowing and spending and inhibit saving is inflation.
From 2008 through 2011, commodity prices soared because of the policies unleashed during the financial crisis. The flow of liquidity and stimulus is far greater today than it was a dozen years ago. Why should we expect any different reaction from markets?
In 2008, gold fell to a low of $681 during the risk-off period. By 2011, the yellow metal reached $1920.70, a rise of 182%. The March 2020 risk-off low for gold was at $1450.90. The same percentage move from 2008 through 2011 would take gold to a high of $2640 per ounce.
However, the stimulus level is far higher, so a $3000 target or higher seems likely. The first reason gold will eventually break to new and higher highs is that central banks and governments have planted very bullish inflationary seeds.
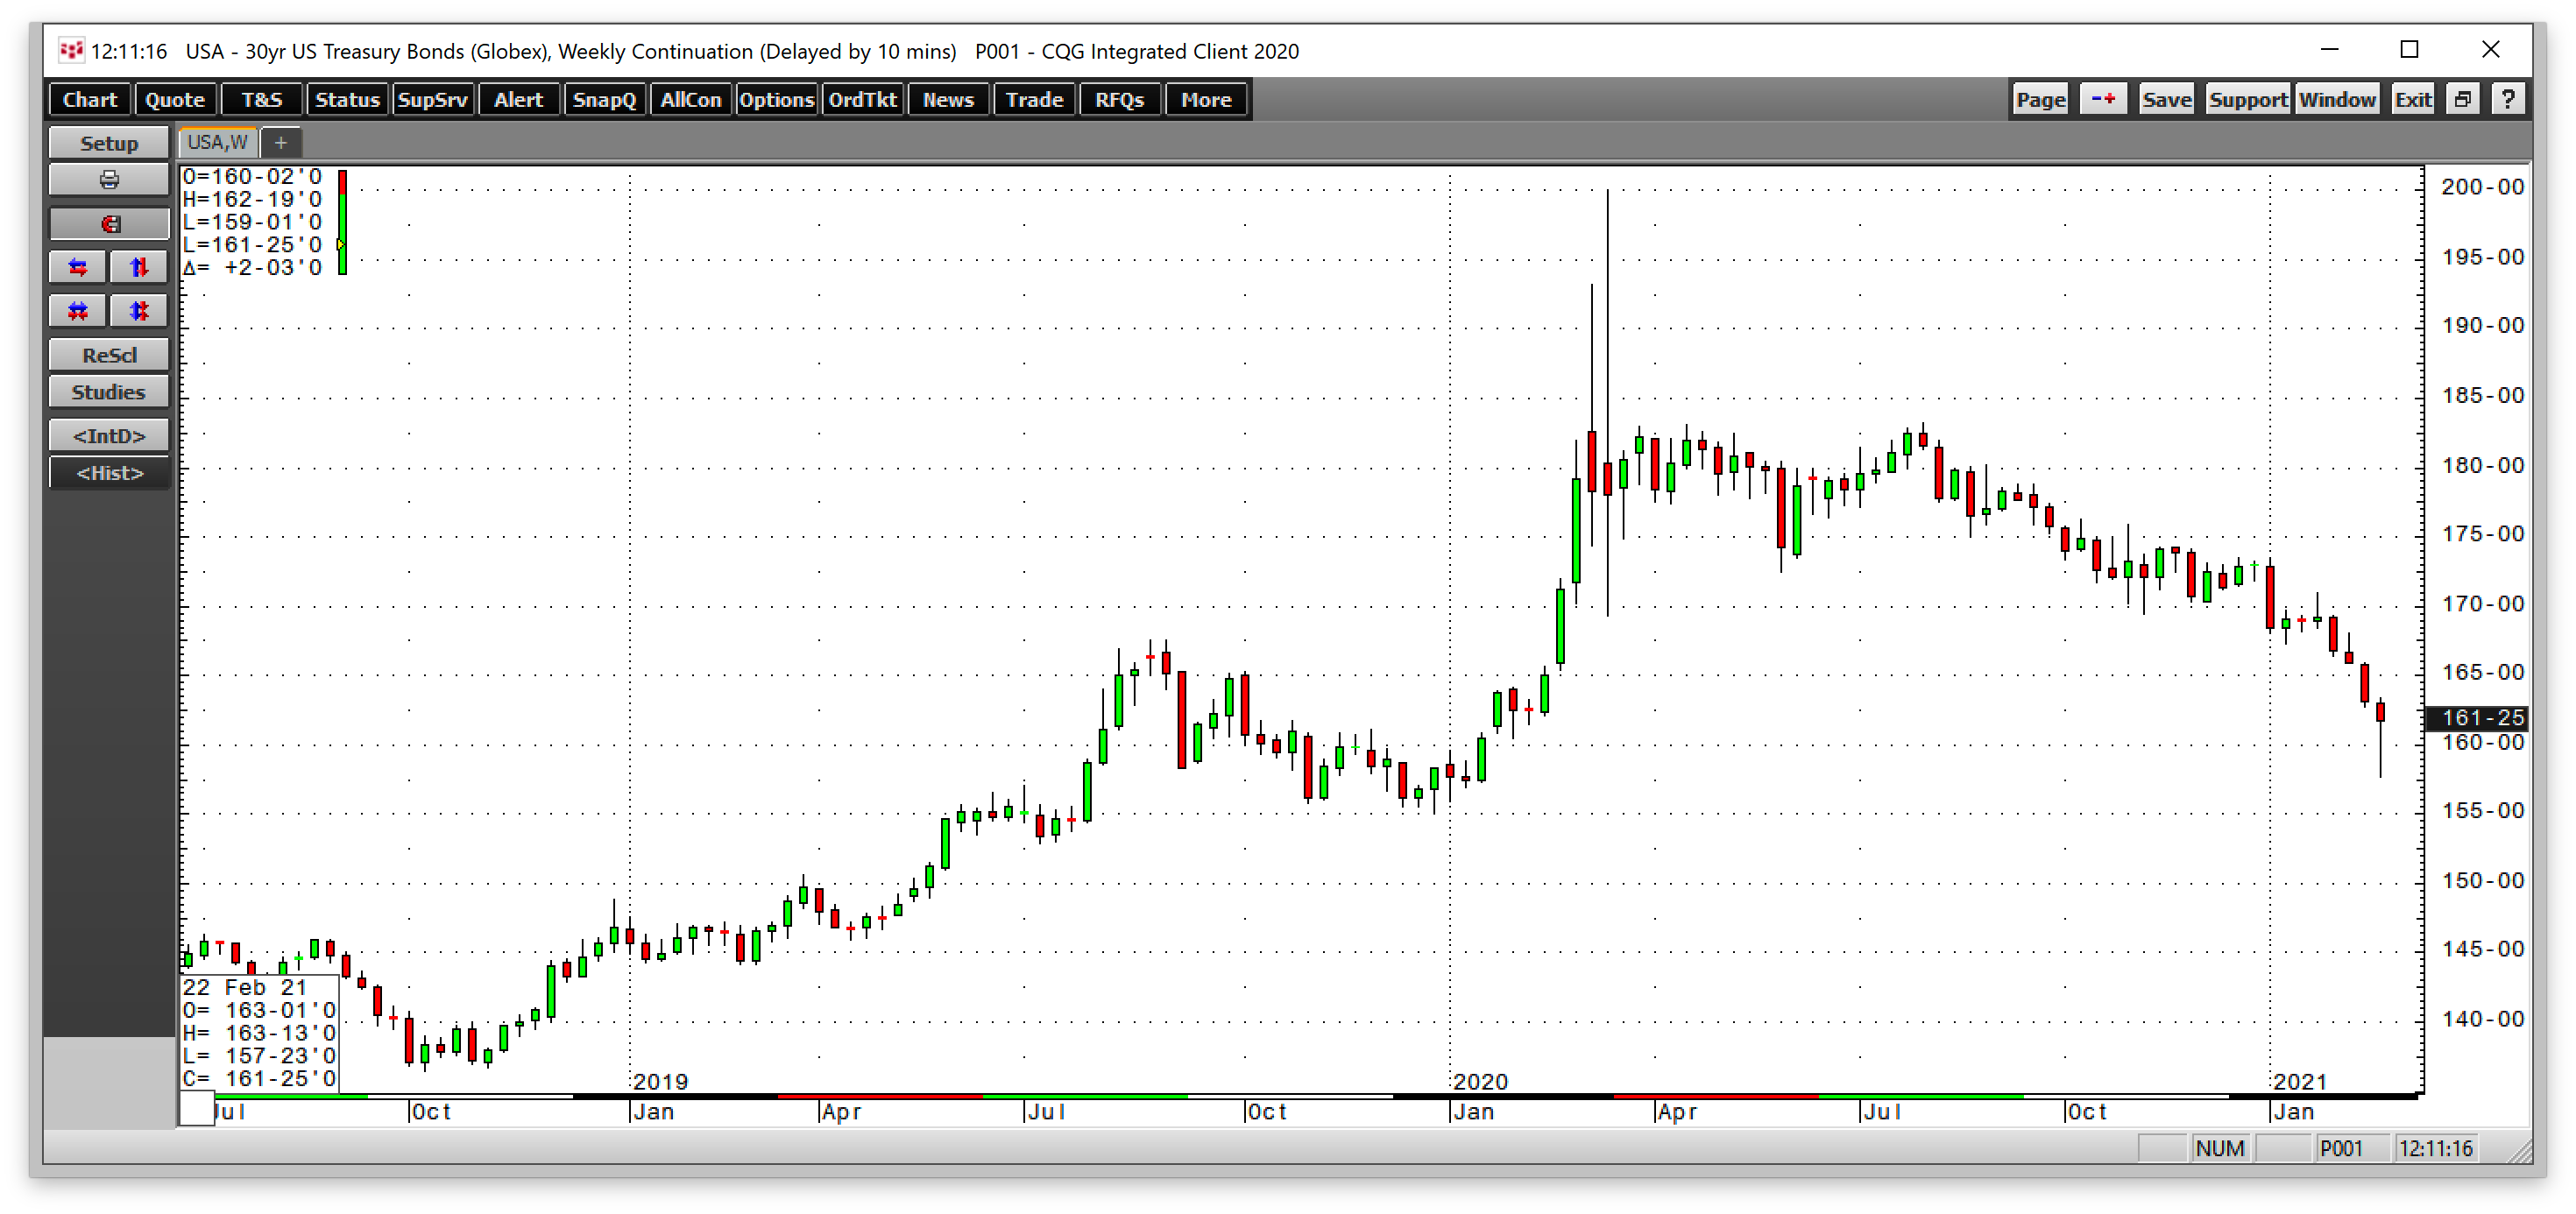
The second reason why gold is heading higher along with inflation is that the bond market tells us the US Fed is wrong about inflation. The Fed continues to report that inflation is running below its 2% average target rate. However, despite purchasing $120 billion each month in debt securities, the bond market has been falling for months.
Source: CQG
The weekly chart shows the 30-year US Treasury bond fell below technical support at the March 2020 169-09 low and was trading at 161-25 on Feb. 26. The next level of support stands at the late 2019 pre-pandemic 155-05 low.
Last week, the low was below the 158 level before the bonds recovered. The Fed controls short-term rates, but the market is the boss when it comes to interest rates further out along the yield curve. Imagine how low the long bond would be if the Fed were not buying $120 billion in debt securities each month.
Falling bonds and rising long-term rates are an ominous sign of inflationary pressures. Rising interest rates increase the cost of carrying gold and other commodities. However, when rates move higher because of inflation, it is a different story.
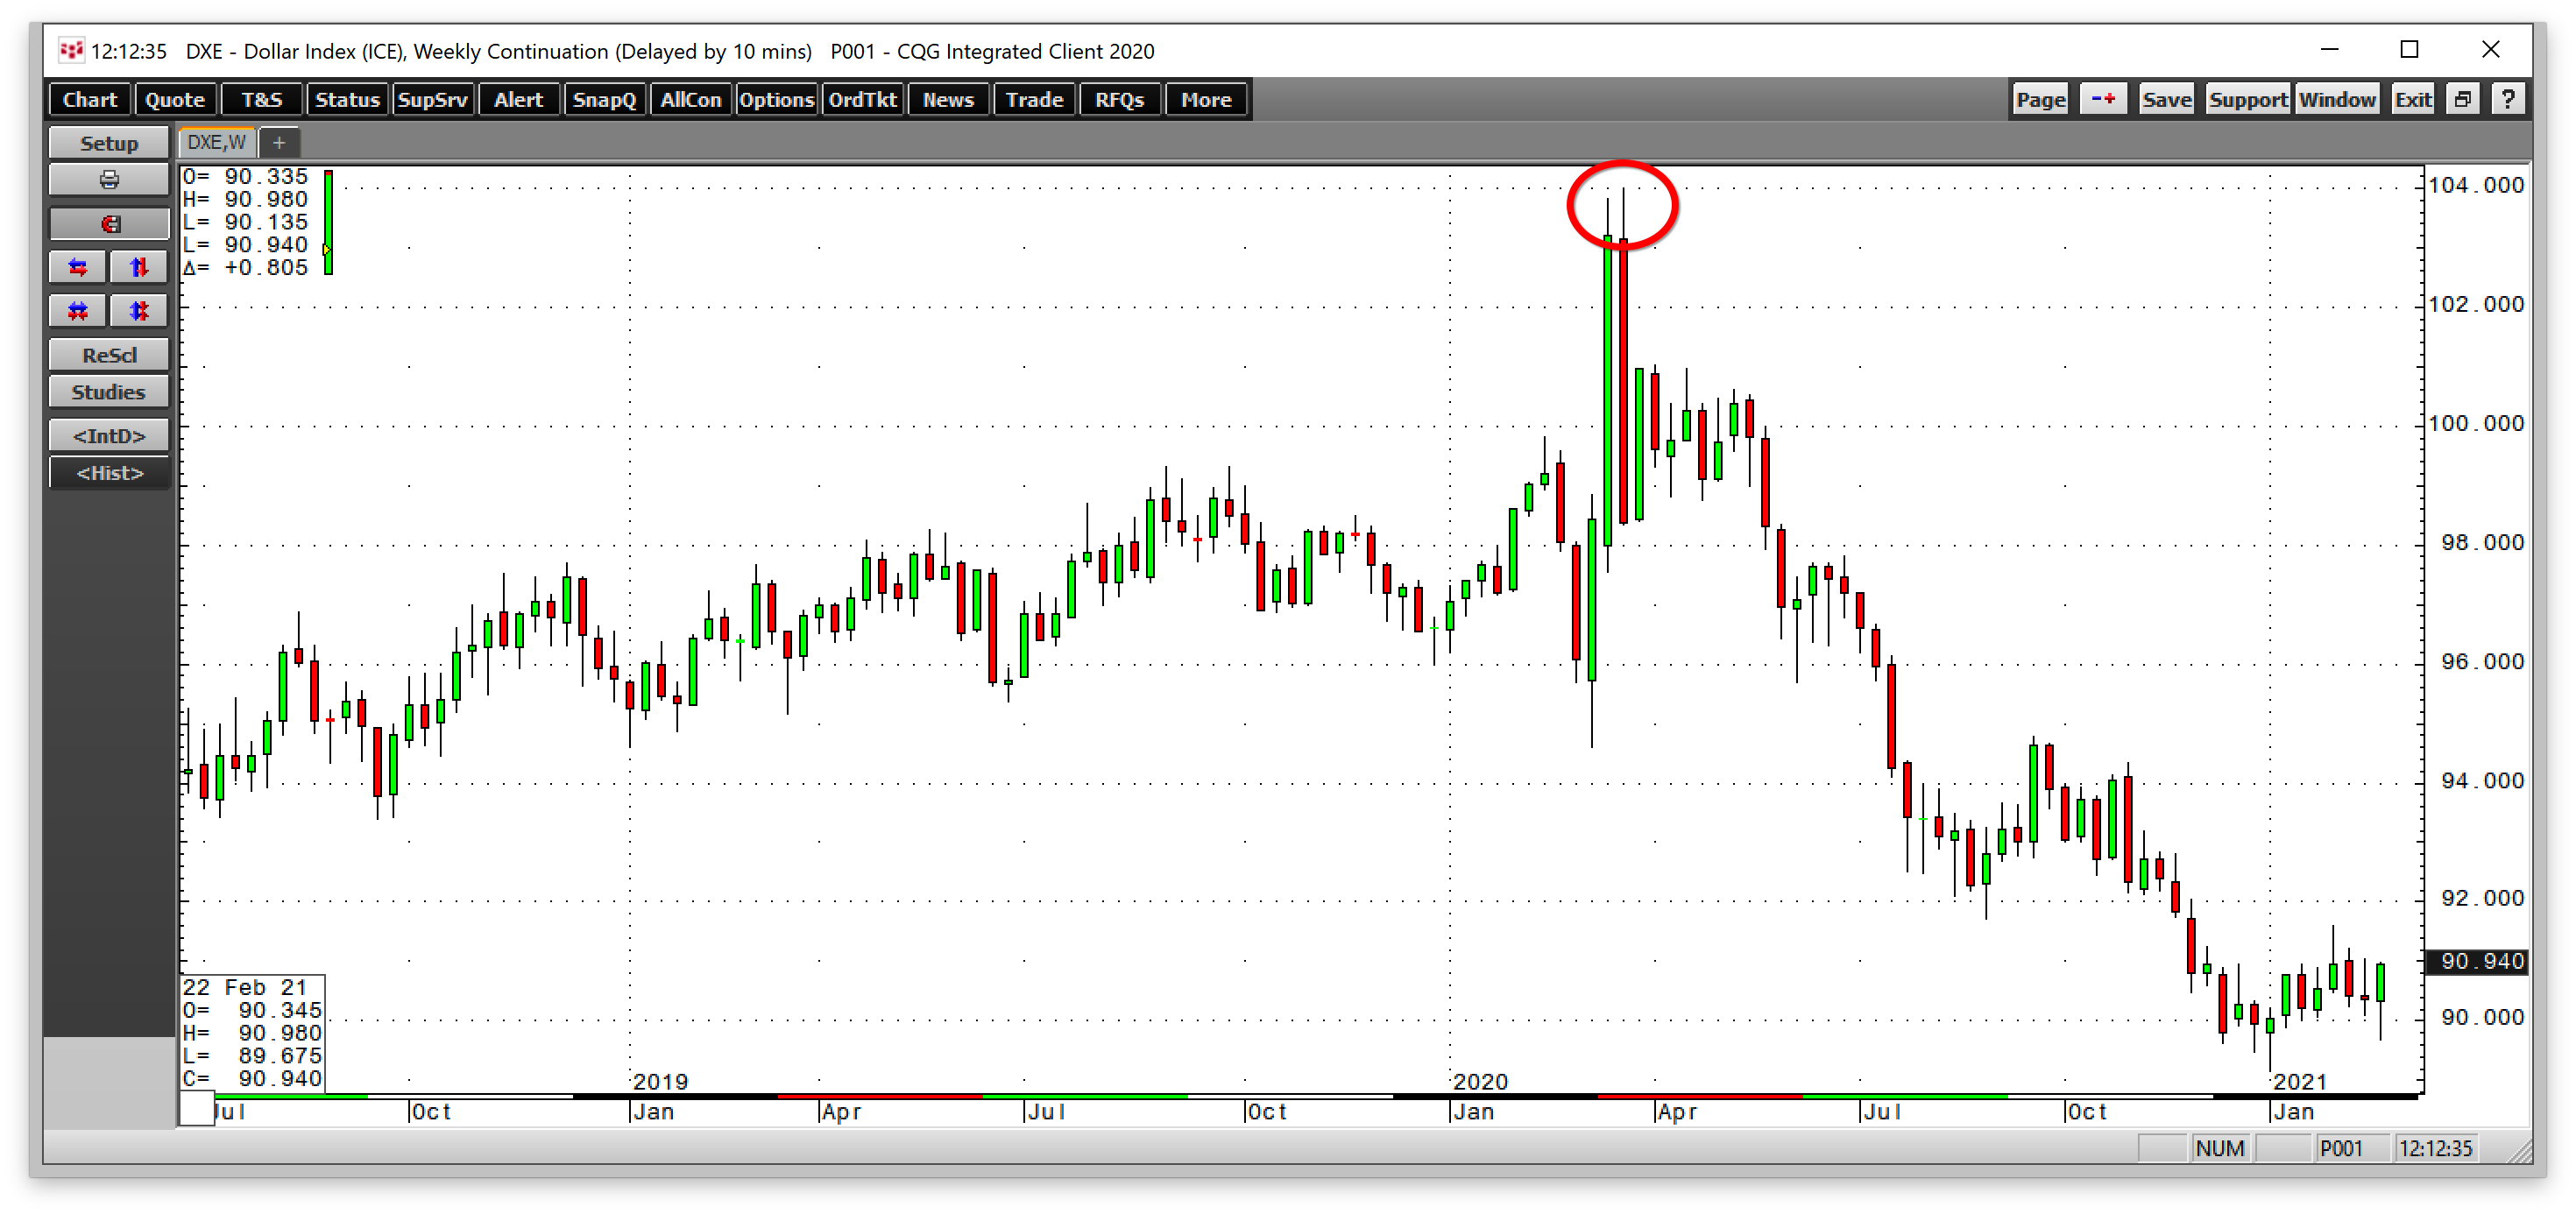
Finally, the dollar is the world’s reserve currency and pricing mechanism for most commodities. Gold is no exception. A falling dollar tends to be highly supportive of gains in the yellow metal. Rising long-term interest rates should support the dollar, but it is sitting near the lowest level since February 2018 against other world reserve currencies.
Source: CQG
The chart of the US Dollar Index, which measures the greenback against the euro, pound, yen, and other reserve currencies, shows that it declined from 103.96 in March 2020 to just below the 91 level at the end of February. Critical technical support stands at the February 2018, 88.15 low. A weak dollar tends to be bullish for commodity prices, including gold.
Use weakness as a buying opportunity; GDXJ could turbocharge the next rally
Gold is resting, but it is bound to awaken from its hibernation and consolidation period sooner rather than later. I expect gold to rise to a new record high before the end of 2021 as inflationary pressures continue to increase.
Mining shares tend to outperform gold on the upside on a percentage basis and underperform during downside corrections. Junior mining shares tend to provide even more leveraged exposure to gold as they produce and explore for the yellow metal.
Choosing individual mining shares can be a challenge as companies carry idiosyncratic risks due to management and specific mining properties. I prefer a portfolio approach to the sector when looking to turbocharge my gold exposure during price corrections.
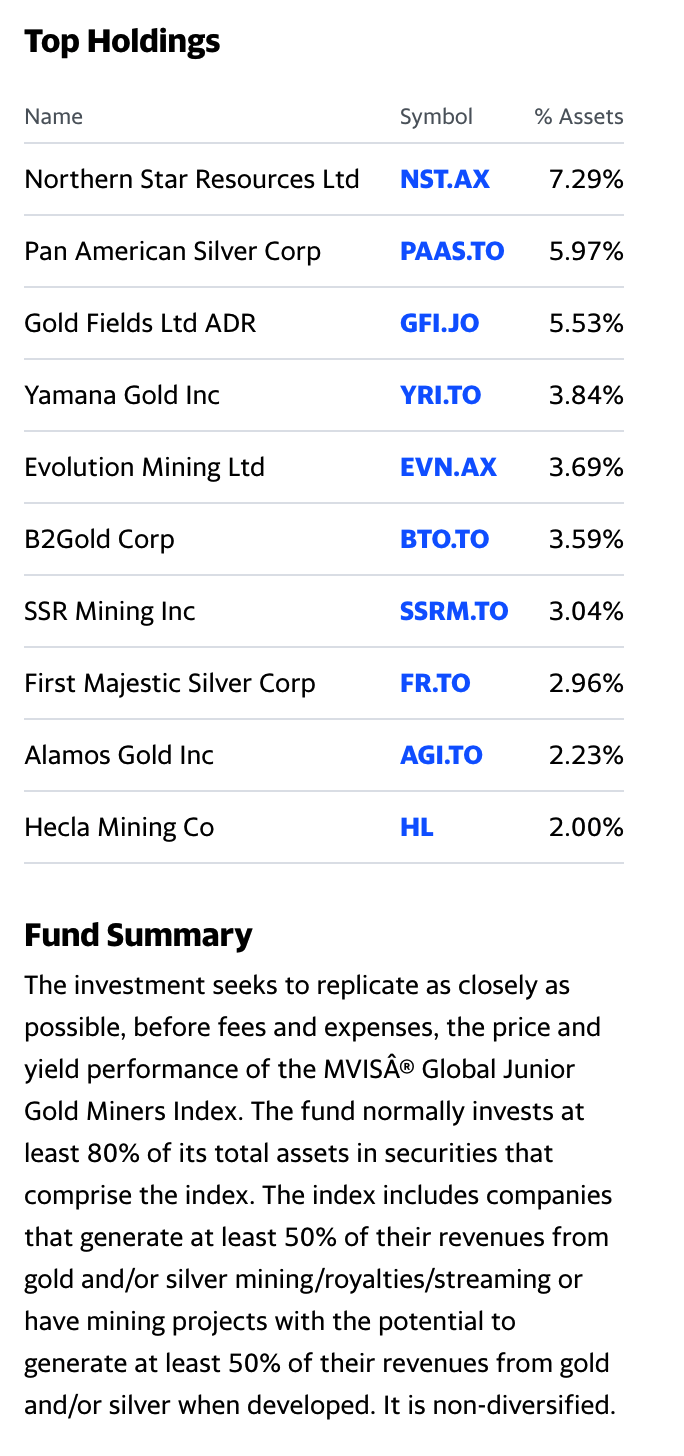
The top holding and fund summary of the VanEck Vectors Junior Gold Miners ETF product include:
Source: Yahoo Finance
GDXJ has net assets of $5.77 billion and trades an average of over 7.4 million shares each day, making it a highly liquid product. The ETF product charges a 0.54% expense ratio.
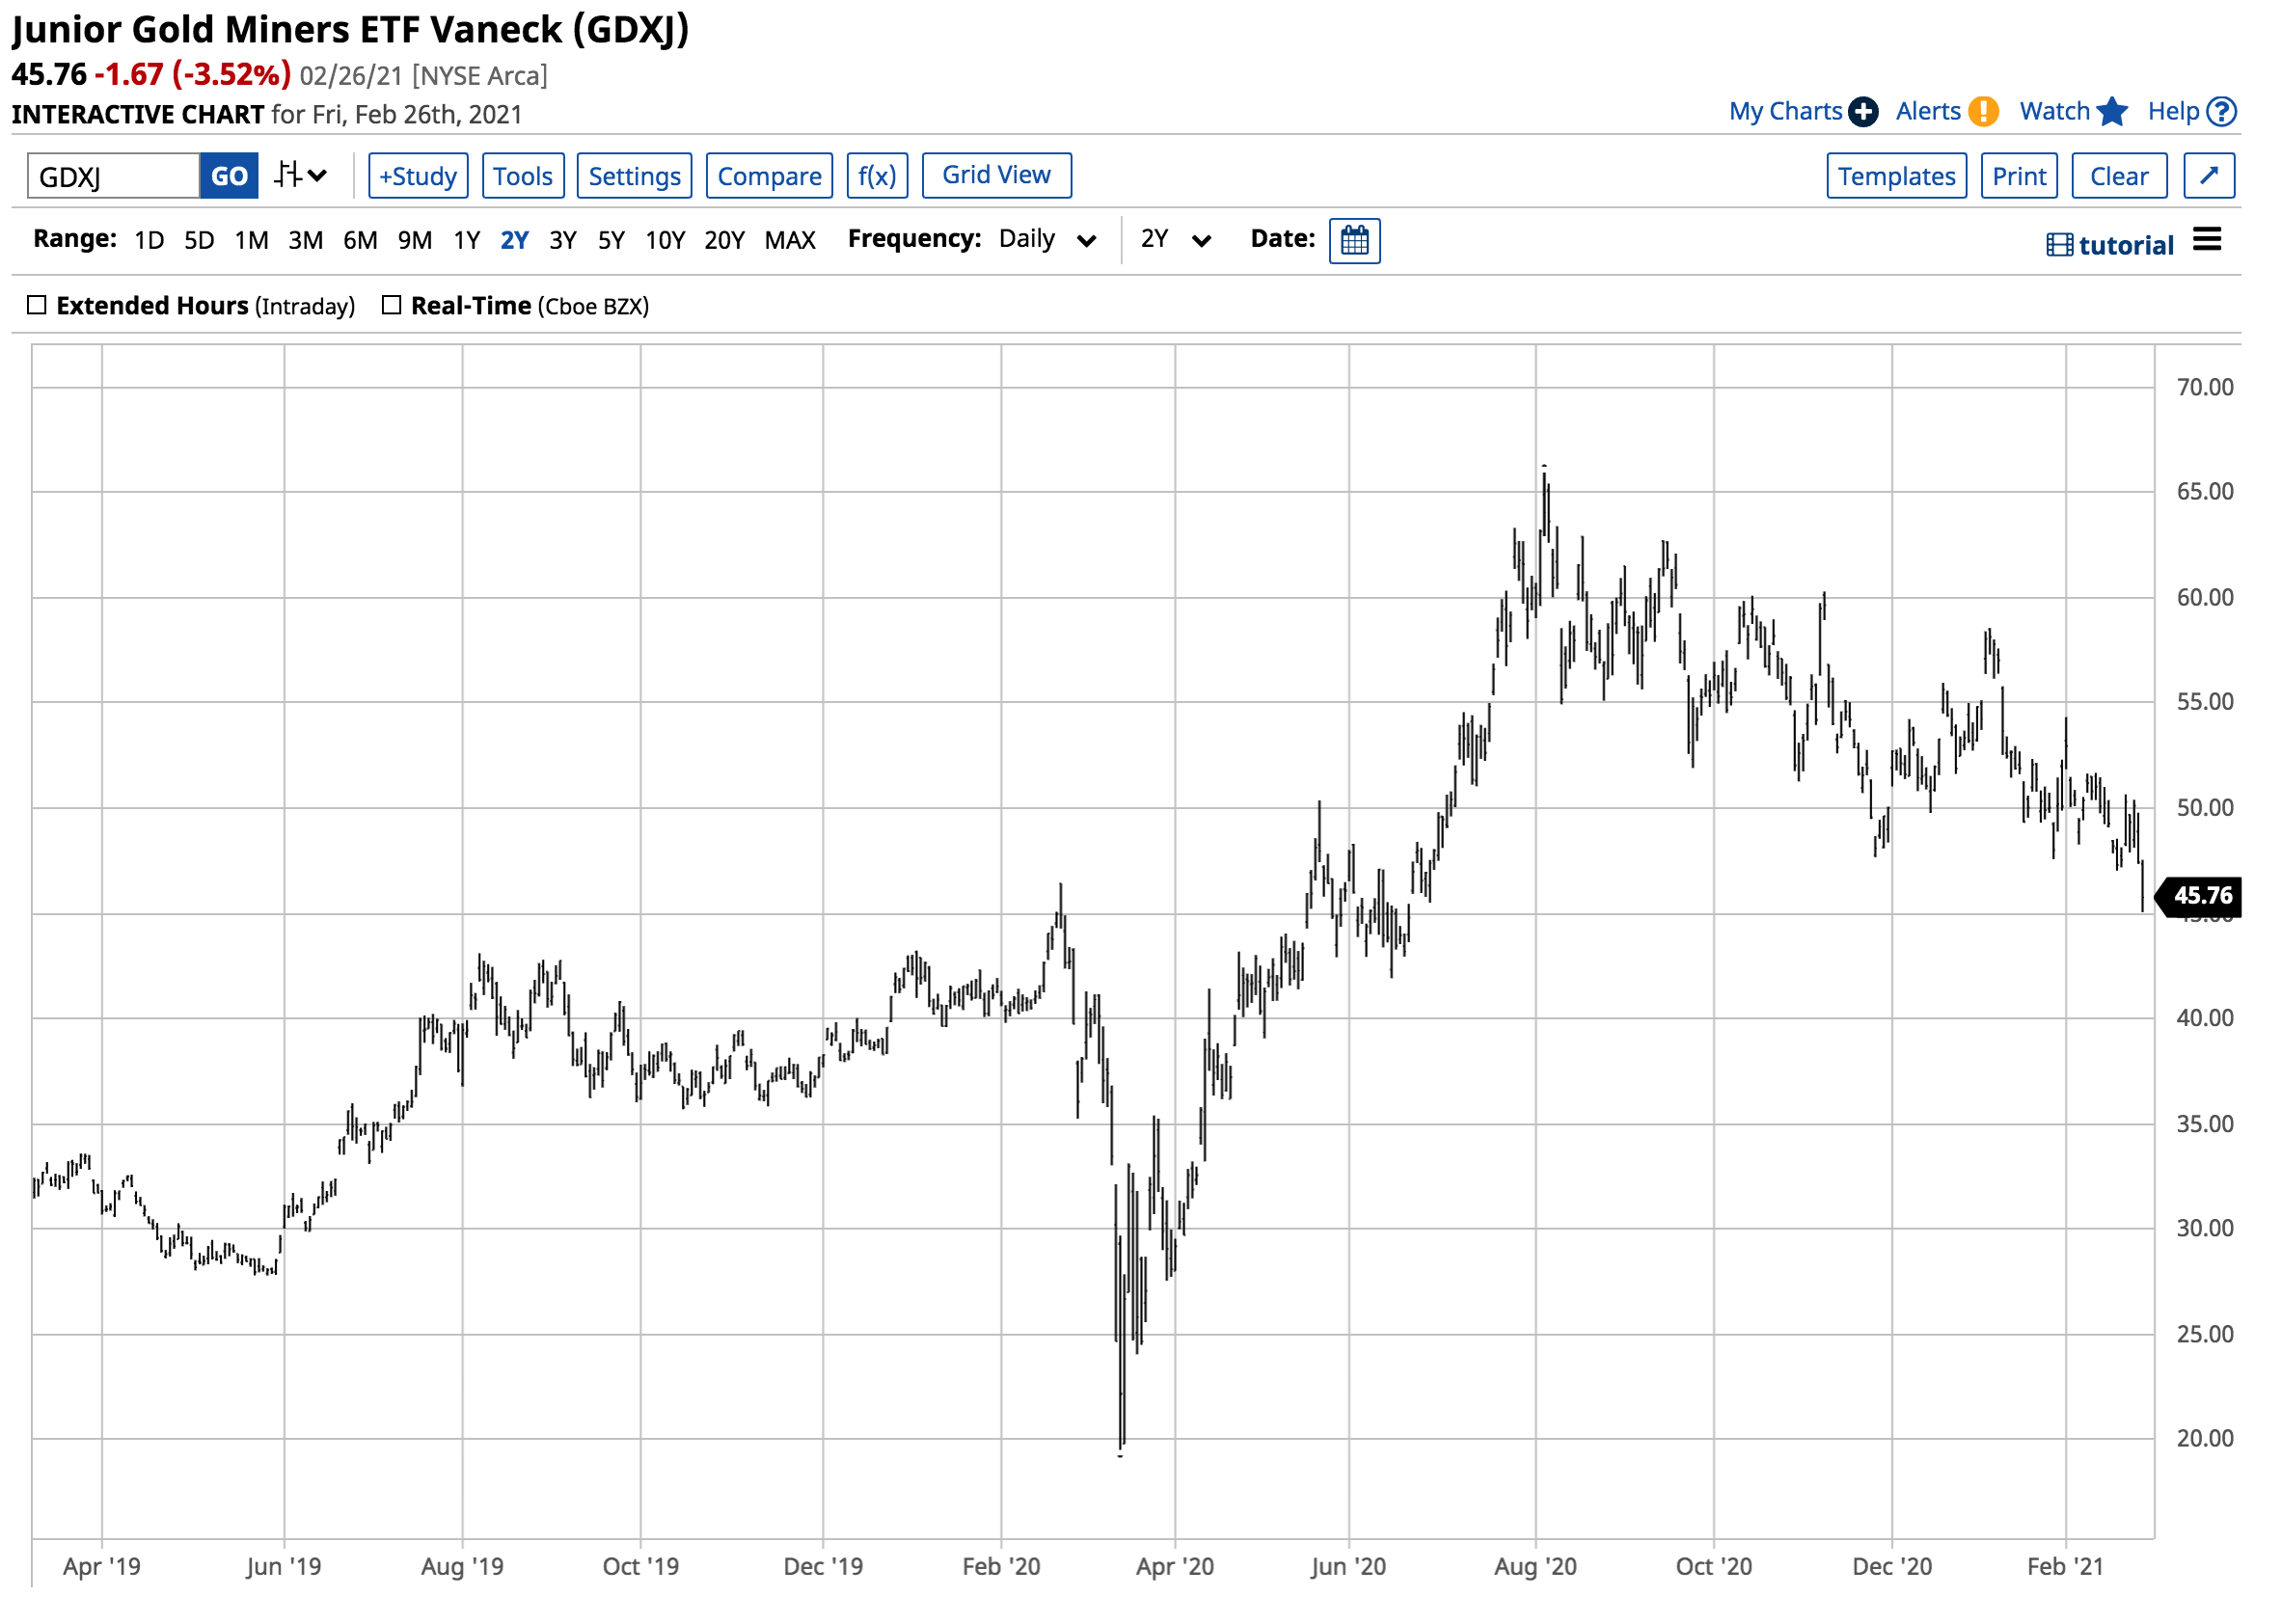
In 2020, gold rose from $1450.90 to $2063 or 42.2%.
Source: Barchart
Over the same period, GDXJ rose from $19.52 to $65.95 per share, delivering a 237.8% gain. GDXJ did over five times better than gold on a percentage basis from the 2020 low to the high.
There is nothing wrong with gold; it is resting. Now is the time to look at products like GDXJ that will turbocharge the next move higher on a percentage basis.
