
This article was written exclusively for Investing.com
I was reminded this week of the scene in The Fellowship of the Ring where the travelers attempt to cross over Caradhras, the imposing mountain that stands in their way along the path they have chosen. As they climb there comes a wicked storm that gets worse as they advance, till it seems the mountain itself resists them.
“The Company halted suddenly, as if they had come to an agreement without any words being spoken. They heard eerie noises in the darkness round them. It may have been only a trick of the wind in the cracks and gullies of the rocky wall, but the sounds were those of shrill cries, and wild howls of laughter. Stones began to fall from the mountain-side, whistling over their heads, or crashing on the path beside them...
“'We cannot go further tonight,' said Boromir. 'Let those call it the wind who will; there are fell voices on the air; and these stones are aimed at us.'"
And so it felt this past week. After the prior trading week culminated in a sharp pullback in stocks as investors loudly testified that Fed talk of 75bps was not welcome, bulls were ready to re-scale the heights this week. But the inflationary stones kept rolling down the mountain.
On Tuesday, the S&P CoreLogic Case-Shiller 20-City Home Price Index (which is a mouthful even if you abbreviate it) exceeded expectations and reached a new all-time year/year high of 20.2%. This matters because home prices tend to lead rents by about 18 months, so if home prices are still soaring now it means that rent inflation in the CPI is likely to remain high and sticky straight through 2023. Remember, Rents (Owners’ Equivalent Rent plus Rent of Primary Residence) represent about a third of the CPI consumption basket, and 40% of core CPI, so if rents are growing at 5% we aren’t going to get back to 2% CPI unless lots of other things are in deflation. Which seems, to put it mildly, fairly unlikely to happen in the near term.

It obviously isn’t just housing; last week Soybean Oil reached a new record as Indonesia (the top global producer) banned exports of palm oil. I’ll bet in 2019 you weren't worried about Indonesian action on palm oil, but here we are as these stones keep dropping down the mountain. Corn futures also neared an all-time record, thanks to the slowest planting season in the US since 2013.
Still, on Thursday, the Fellowship made a strong push higher up the mountain as the perfect GDP number was reported. The headline figure was negative, which presumably takes a 75bps Fed hike this week off the table, but the underlying details weren’t horrible.
Stocks rocketed higher. If there was ever a sign that the market nowadays cares more about liquidity than about growth, this was it. But that’s not good, that’s bad! Unfortunately, on Friday the Employment Cost Index smashed through expectations and traders started putting that 75bps hike back in…for the June meeting.
It also didn’t help that Treasury Secretary Yellen on Thursday told us all that “large negative shocks” are inevitable. Whoops. It's starting to get slippery up here.
Taking a Step Back…
Did you notice that Japan is planning to spend more money to “ease inflation pain”? Did you notice that Mexico is trying price controls, although so far the government is merely negotiating rather than mandating? Did it make you wonder if these folks realize how much more like the 1970s this seems, every day?
With the GDP report last week, it’s helpful to remember where we are in the process of re-normalization after the patently absurd scale of the monetary pandemic response. The chart below illustrates that the M2 money supply since year-end 2019 has in aggregate grown about 42%; GDP has grown 3%; and prices have risen 9%, which makes us all unhappy.
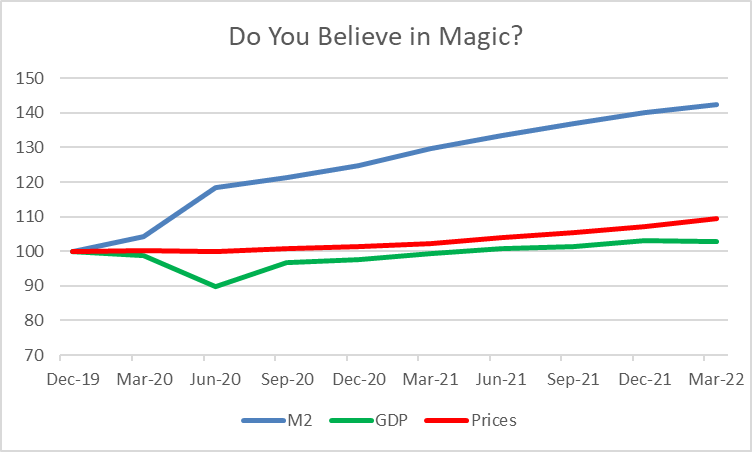
But this is where it’s helpful to remember how these numbers tie together. In the absence of a permanent change in monetary velocity, the aggregate rise in prices plus the aggregate rise in real output must equal the aggregate change in money. And, for more than 100 years it has.
In other words, the only reason that the red and green lines do not currently add up to the blue line is because money velocity moved dramatically lower in mid-2020. This was caused by a sharp decline in interest rates (which decreases the opportunity cost of holding cash) and a sharp rise in the demand for “precautionary” cash balances.
The first of these is changing, and I suspect the second is as well. So far, however, velocity has only retraced slightly from the lows.
The chart, though, makes stark what needs to happen if we are to avoid a much larger adjustment in prices. This needn’t happen in a quarter or a year, but one of these things must eventually happen since mathematically, these are all tied together:
- A dramatic increase in real output
- A dramatic decrease in the money supply—not its growth rate, but its level
- Velocity must permanently remain near all-time lows
These can combine, but right now we need to account for the 30% gap (42% - 9% - 3%) going forward unless money velocity has truly shifted lower forever. I don’t feel optimistic that M2 is going to head lower, especially since it is still growing near double-digit rates.
Real growth is constrained by physical limits, and surely can’t provide more than 4% per year in the best case anyway. And that means that either velocity must stay low, or prices have a lot further to rise in the months and years ahead. The market, even after the selloff, remains on a high, rocky place with not many smooth footpaths forward.
And now it's Payrolls week, and Fed week! Brace yourself.
Ultimately, the Fellowship of the Ring was forced to abandon Caradhras, and instead take a path through the Mines of Moria. I wonder if that's next. And if so, who plays the part of the Balrog? Fly, you fools!
Michael Ashton, sometimes known as The Inflation Guy, is the Managing Principal of Enduring Investments, LLC. He's a pioneer in inflation markets with a specialty in defending wealth against the assaults of economic inflation, which he discusses on his Cents and Sensibility podcast.