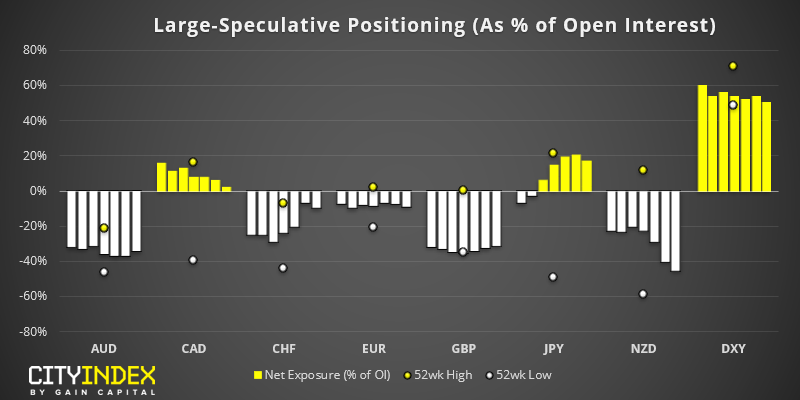
As of Tuesday 3rd September:
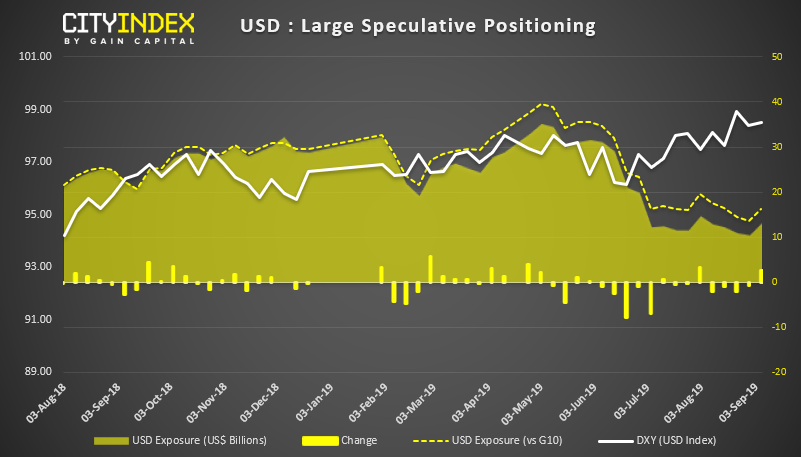
USD: We’ve been following the divergence between broader USD positioning (using IMM data) and price action on DXY (the US dollar index). Last week’s bullish increased snapped a 4-week streak of bullish reduction, and it’s possible we may have seen a low for USD bullish net-exposure.
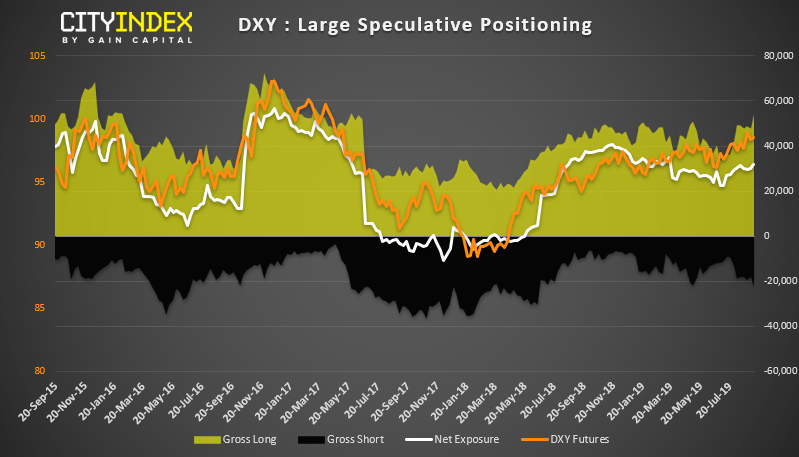
DXY: Whilst IMM data provides a broader view of the USD, it is not a tradable product, whereas DXY is. Whilst net-long exposure hit a 6-month high, and gross long exposure is at an 18-month high. However, as we also see gross-short exposure increase, we don’t suspect this to be a sentiment extreme just yet and could lay the groundwork for a sustainable bullish move. Of course, a stronger USD would create a headache for the Fed (and no doubt catch Trump’s attention).
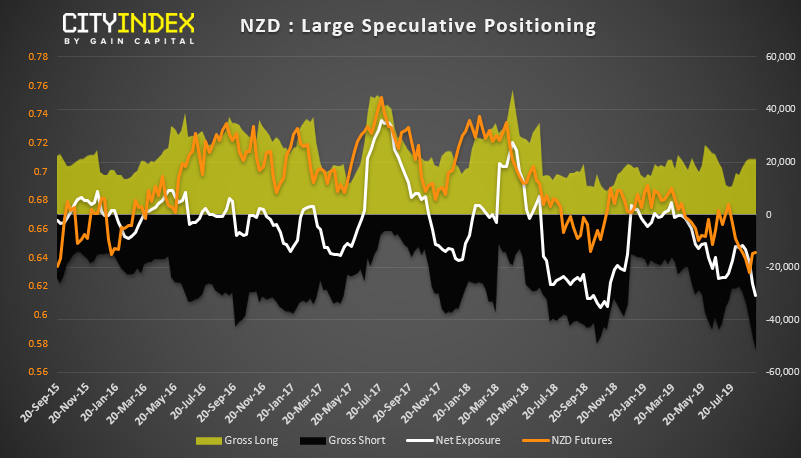
NZD: Traders are their most bearish on the Kiwi dollar in 6 months. However, net-short positioning is approaching a historical extreme, and gross-short exposure is at a record high. It’s possible we’re approaching or have reached a sentiment extreme, and worth noting that prices have rallied over 2.6% since the low on the 3rd of September to suggest short covering is already underway, in light of improved trade sentiment.
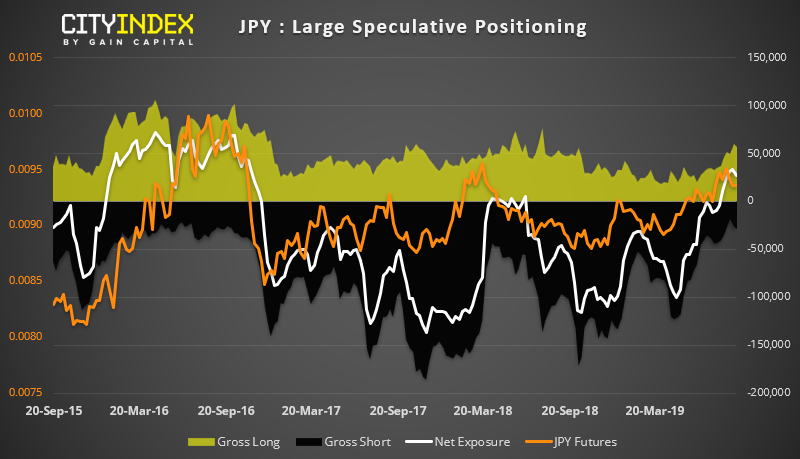
JPY: We suspect the net-long positioning on the Japanese yen may have reached a peak. Traders reduced net-long exposure by -5.9k contracts, its first weekly decline in 6 weeks, although bears also reduced exposure by -2.6k contracts to show lighter volumes among large speculators. Whilst this is not an all-out bearish case, it does show a hesitancy for bulls to push higher. Moreover, improved relations between the US and China since the report as compiled makes it likely we’ve seen further longs closed and shorts initiated. We wouldn’t be too surprised to see JPY revert to net-short exposure over the coming week/s.
As of Tuesday 3rd September:
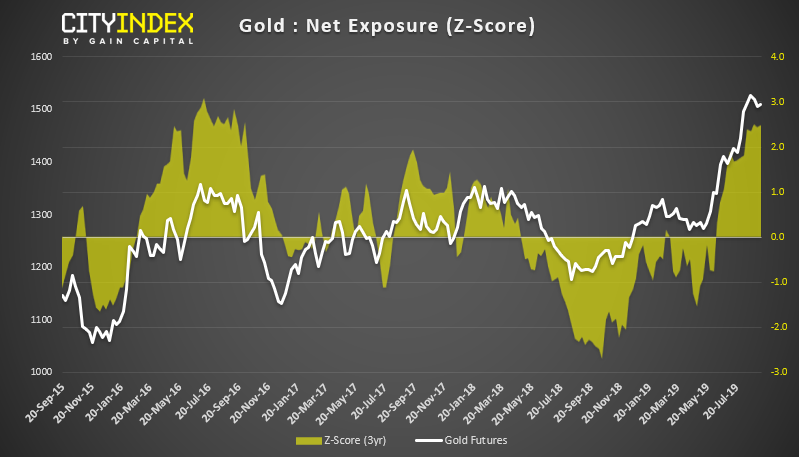
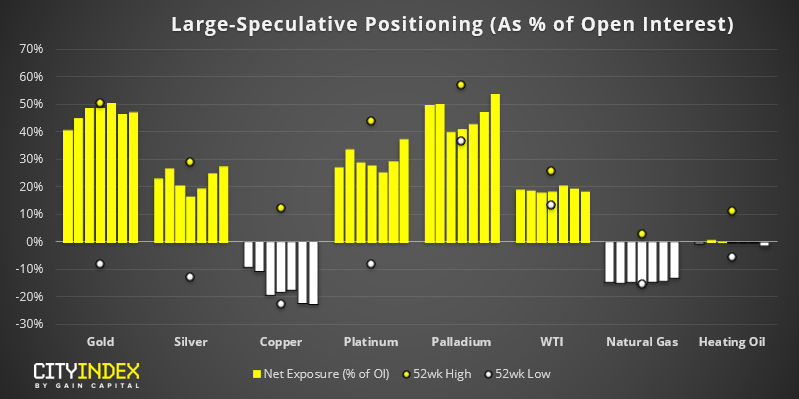
Gold: The scene may finally be set for gold to correct. It’s been sending warning signs for several weeks of possible over-extension, with exposure at multi-year highs and Z-scores remaining above +2 standard deviations. However, markets now rallying on reports of new US-China trade-talks set for October, demand for gold has fallen to send it -3.4% lower from its highs. Even before this development, we note that the long/short ratio had fallen from to 5.6 from 6.7 just two weeks ago, and the 1-year Z-score is now back below +2 SD for the first time in 3 months.
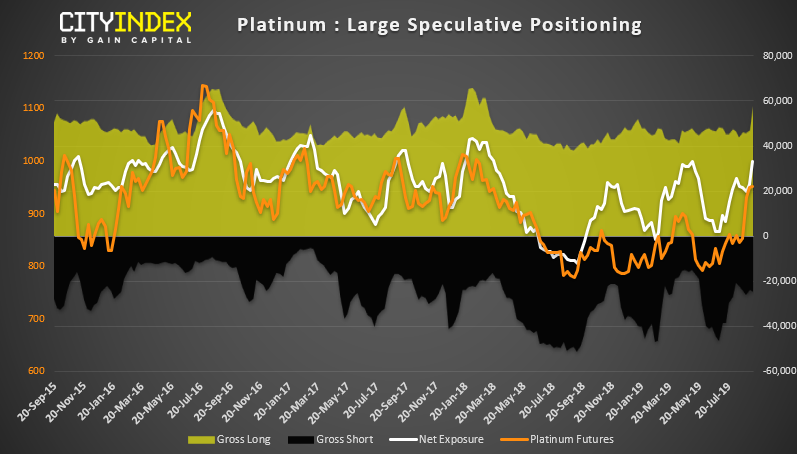
Platinum: Gross long exposure shot up to an 18-month high last week, taking net-long exposure to its most bullish level since May. Prices are also at their highest level since March 2018, although resistance has been found at a long-term bearish trendline, which began in August 2011. Like gold, it could be due to a correction but, given the bullish breakout of long exposure, we suspect Platinum could be trading at new highs again over the coming month/s.
Related Analysis: Week Ahead: Draghi’s last ECB meeting and US inflation
Precious GOLD-en signs for bears
"Disclaimer: The information and opinions in this report are for general information use only and are not intended as an offer or solicitation with respect to the purchase or sale of any currency or CFD contract. All opinions and information contained in this report are subject to change without notice. This report has been prepared without regard to the specific investment objectives, financial situation, and needs of any particular recipient.
Any references to historical price movements or levels are informational based on our analysis, and we do not represent or warrant that any such movements or levels are likely to reoccur in the future. While the information contained herein was obtained from sources believed to be reliable, the author does not guarantee its accuracy or completeness, nor does the author assume any liability for any direct, indirect or consequential loss that may result from the reliance by any person upon any such information or opinions."
