Gold prices set for weekly gains on dovish Fed outlook; silver near record high

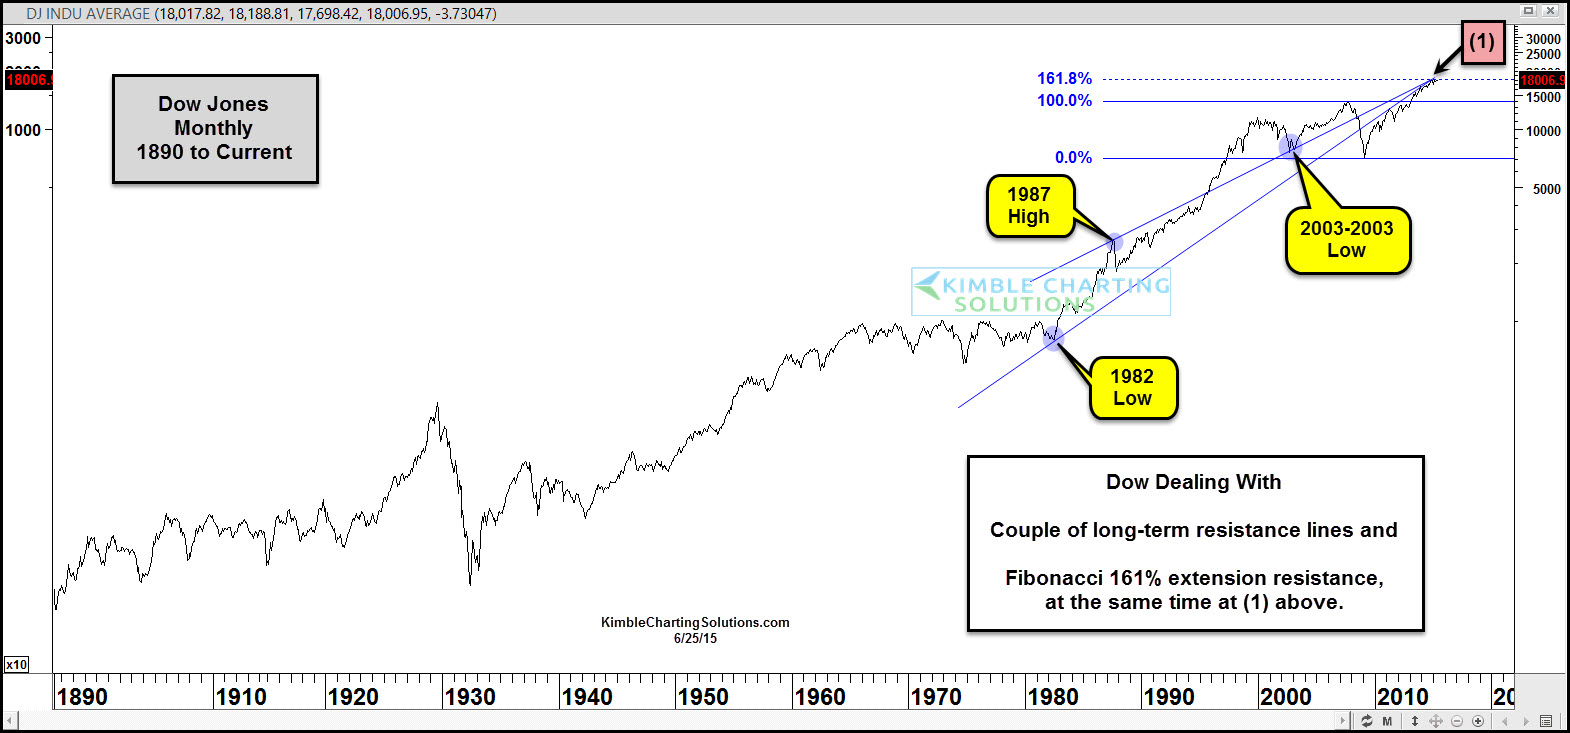
This chart looks at the Dow over the past 115 years. Clearly, it's been in an uptrend since the 2009 lows and remains up.
If one takes the 2007 monthly high and the 2009 monthly low and apply Fibonacci extension levels to those key highs and lows, and the Dow is facing the Fibonacci 161% resistance level at (1) above.
Not only is the index facing this extension level, it's also trying to break above two resistance lines based on some key dates as well. The 1982 low, 1987's highs and the 2002-2003 lows all create lines that could be resistance at the Fib 161% level.
Good For bulls: The Dow breaks Fib and resistance at the same time, which would be very good news for the current trend.
Bad For bulls: The Dow turns weak, here, and breaks support drawn off the 2009 lows.
Humbly, this isn't your typical Fibonacci test of resistance!!!
I told members on Thursday that two of the world's most important stock markets are testing the same 161% extension level at the same time -- a totally rare event that could become extremely important for the current trend.
