
Wall Street fall for the fourth day in a row
US stocks closed negative yesterday, following a negative trend that is lasting for the past 4 days.
The main reason why the markets are falling is that investors are worried that the Federal Reserve will continue to hike the interest rates in order to reduce inflation.
Strong economic data have shown that there is still work to do for the Fed and its monetary policy implemented so far is not as effective as it should be.
That means that Fed could continue to hike interest rates for a longer period in 2023 with the risk of causing a recession.
S&P 500 Technical Analysis - Daily Chart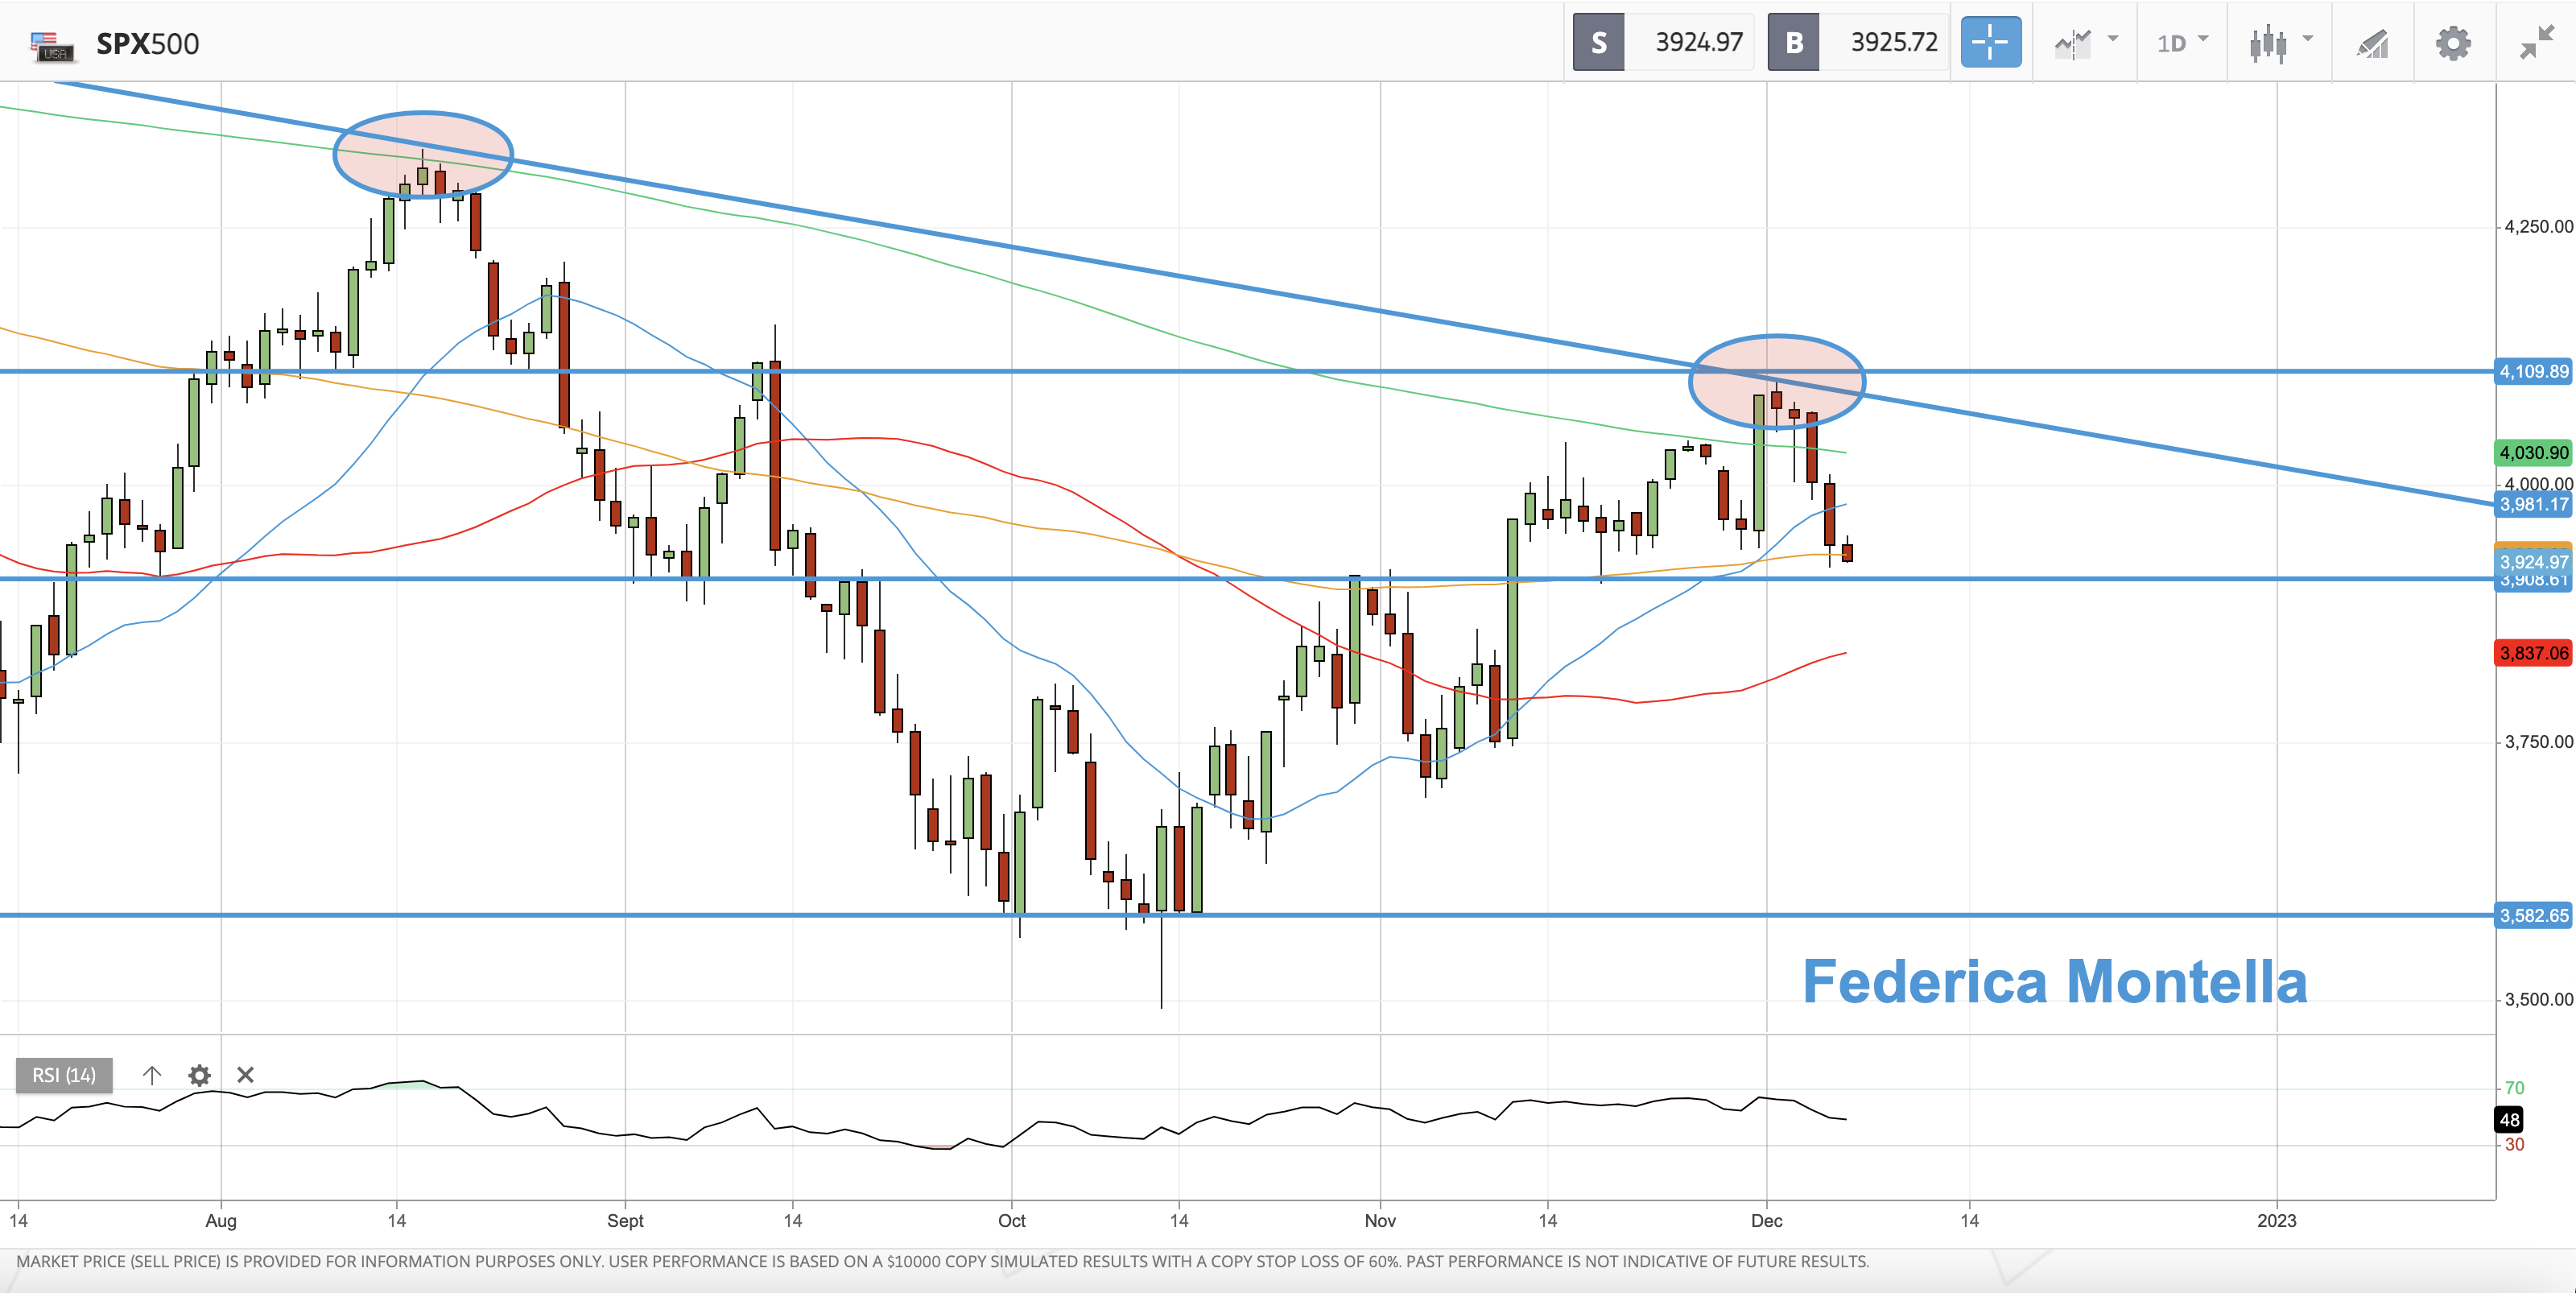
The S&P 500 price broke below the 21-day MA (blue moving average) and it's currently testing the horizontal support line at around 3900.
In the past few days, the index price has also been rejected at the bear market trendline (see red circles on the chart) and the price fell below the 200-day MA (green moving average).
Those are bearish signals.
If the price is able to hold the support at around 3900, we could see the price increase and retest again the bear market trendline, otherwise, prices could drop to the next support level at the 50-day MA (red moving average) at around 3837.
The only option to change the current scenario to a new bullish trend would be for the price to move back above the 200-day MA and then the trendline at around 4100.
The RSI keeps moving lower to 48, indicating a neutral/bearish trend.
US Dollar Index Technical Analysis - Daily Chart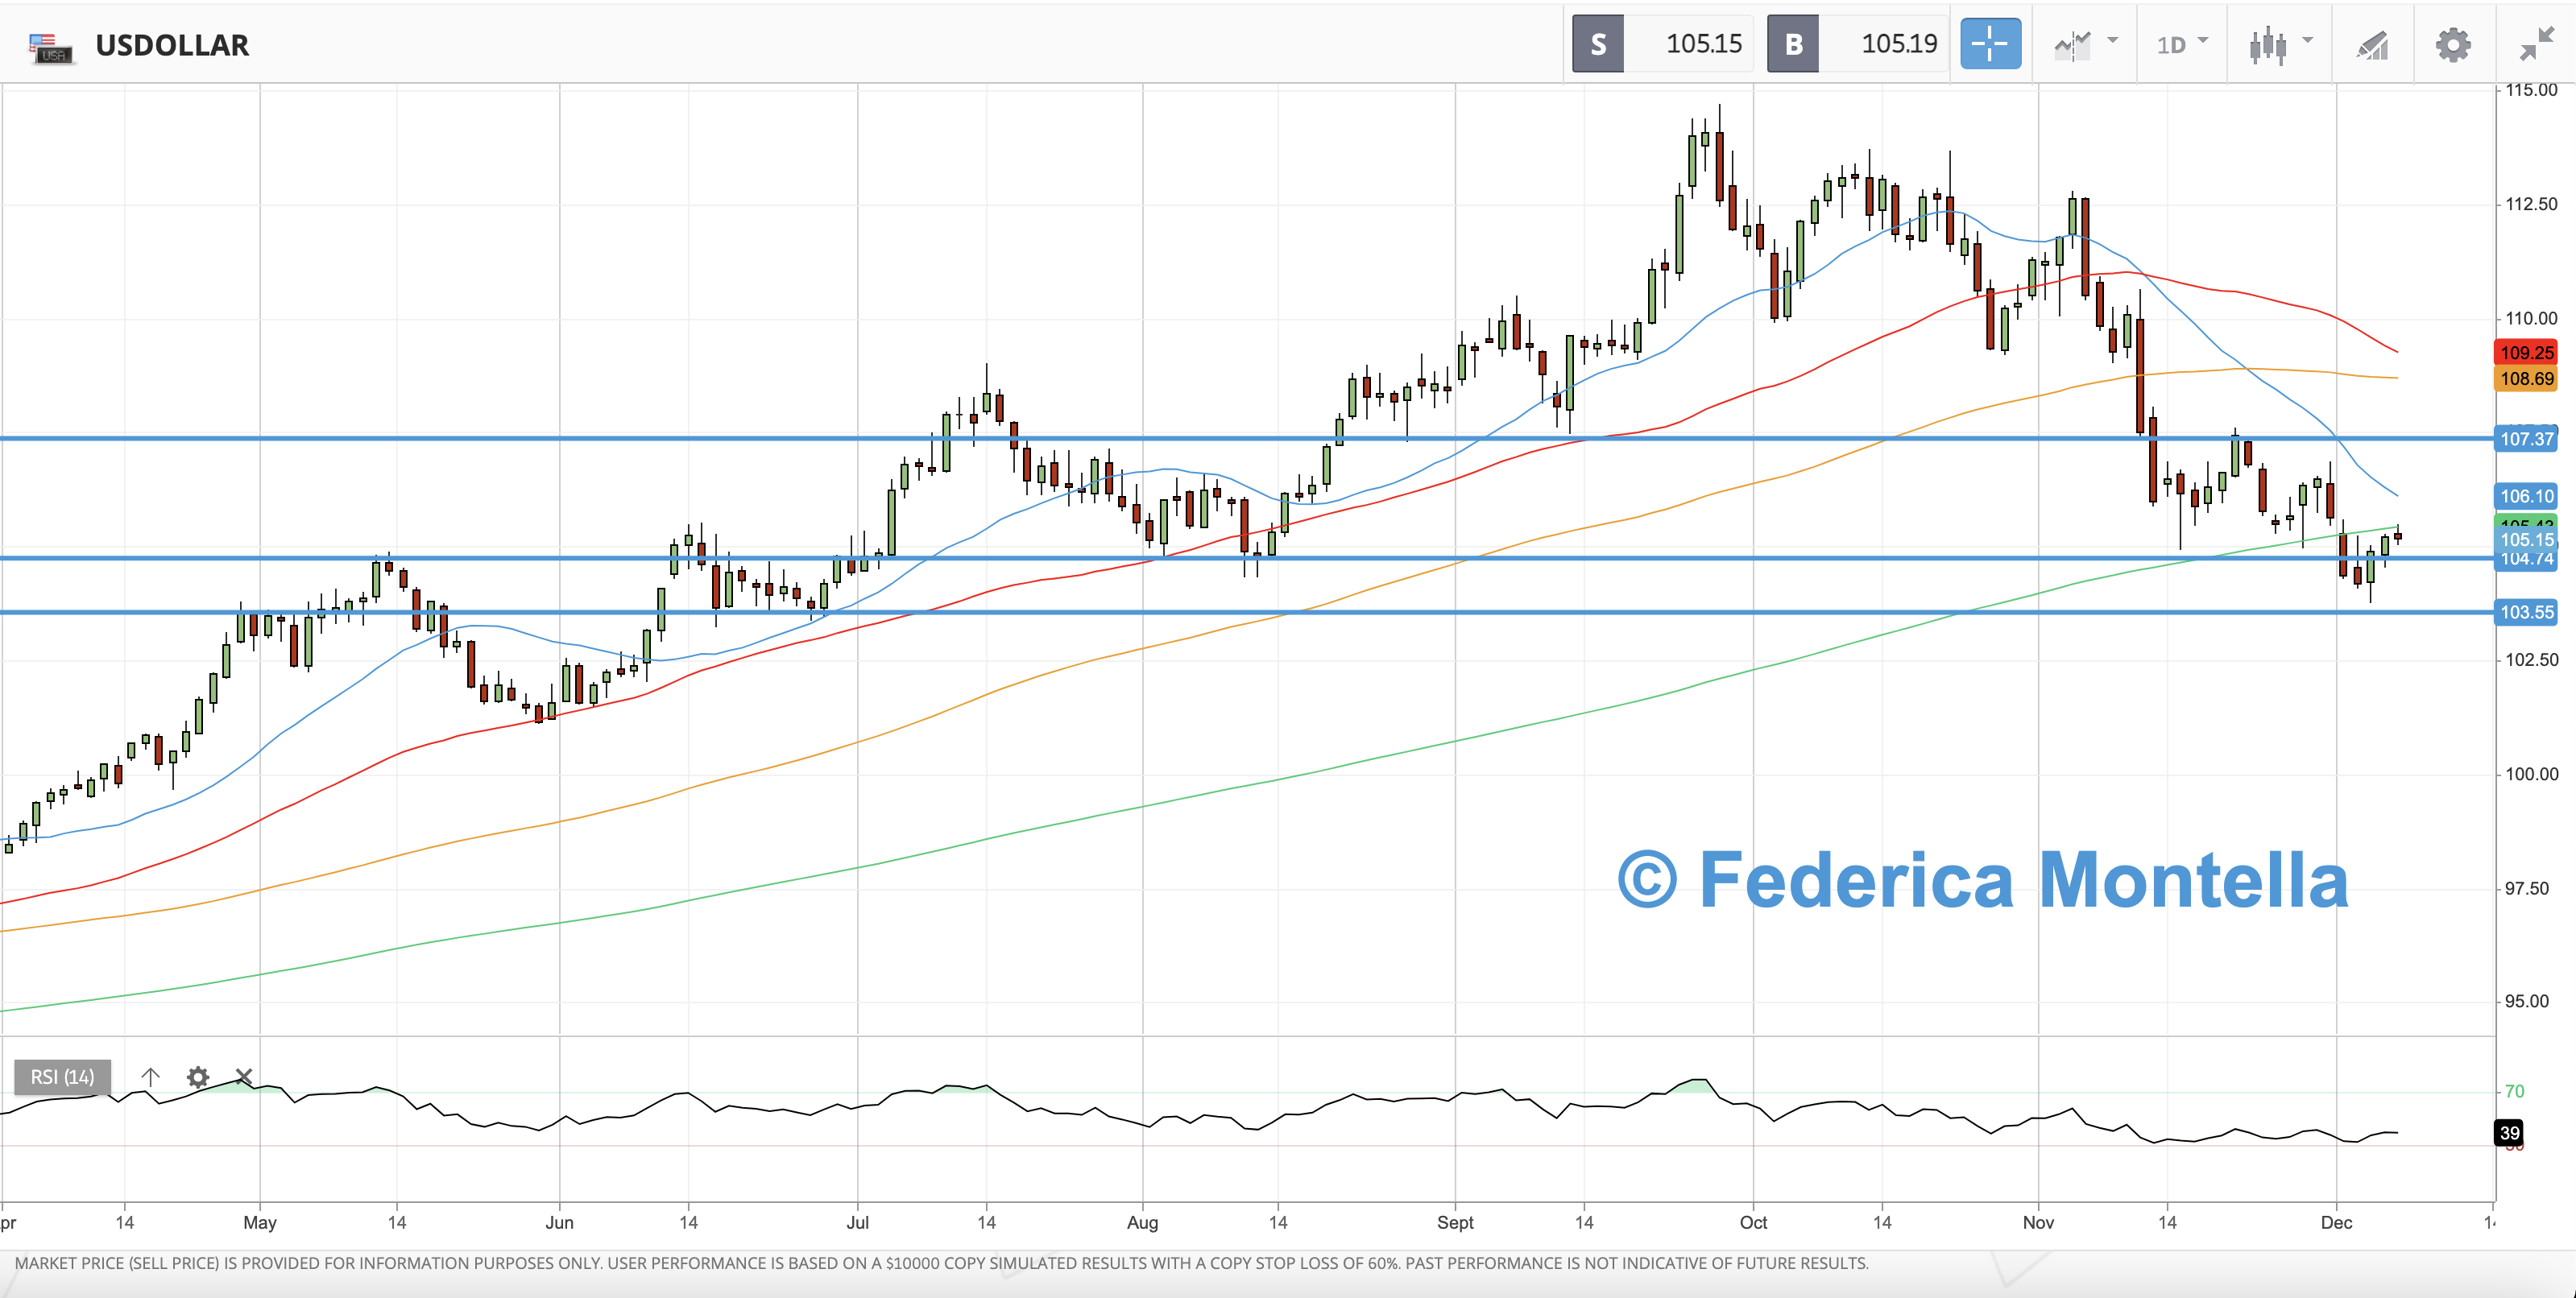
The US Dollar Index measured the value of the US dollar relative to a basket of the top 6 currencies.
Usually, the US Dollar and the S&P 500 move in opposite directions.
Stocks in the S&P 500, like many other assets, are priced in USD.
When the USD is increasing in value, it takes fewer US dollars to buy assets priced in US dollars, so the prices of those assets tend to fall.
For this reason, it is important for US stock investors to monitor the value of this index.
Recently, the U.S. Dollar Index has broken below another key support level, its 200-day MA (green moving average).
This is a bearish signal for the dollar, but it's a bullish signal for stocks.
If the Dollar Index will get rejected and will remain below the 200-day MA, it could support a rally in the S&P 500 Index for some time.
However, both the S&P 500 and the Dollar Index is trading below their key level right now, which is unusual, so the next direction of the dollar will be a leading indicator for US stocks.
Today's price action should provide the answer.
Sentiment Indicator - Fear & Greed Index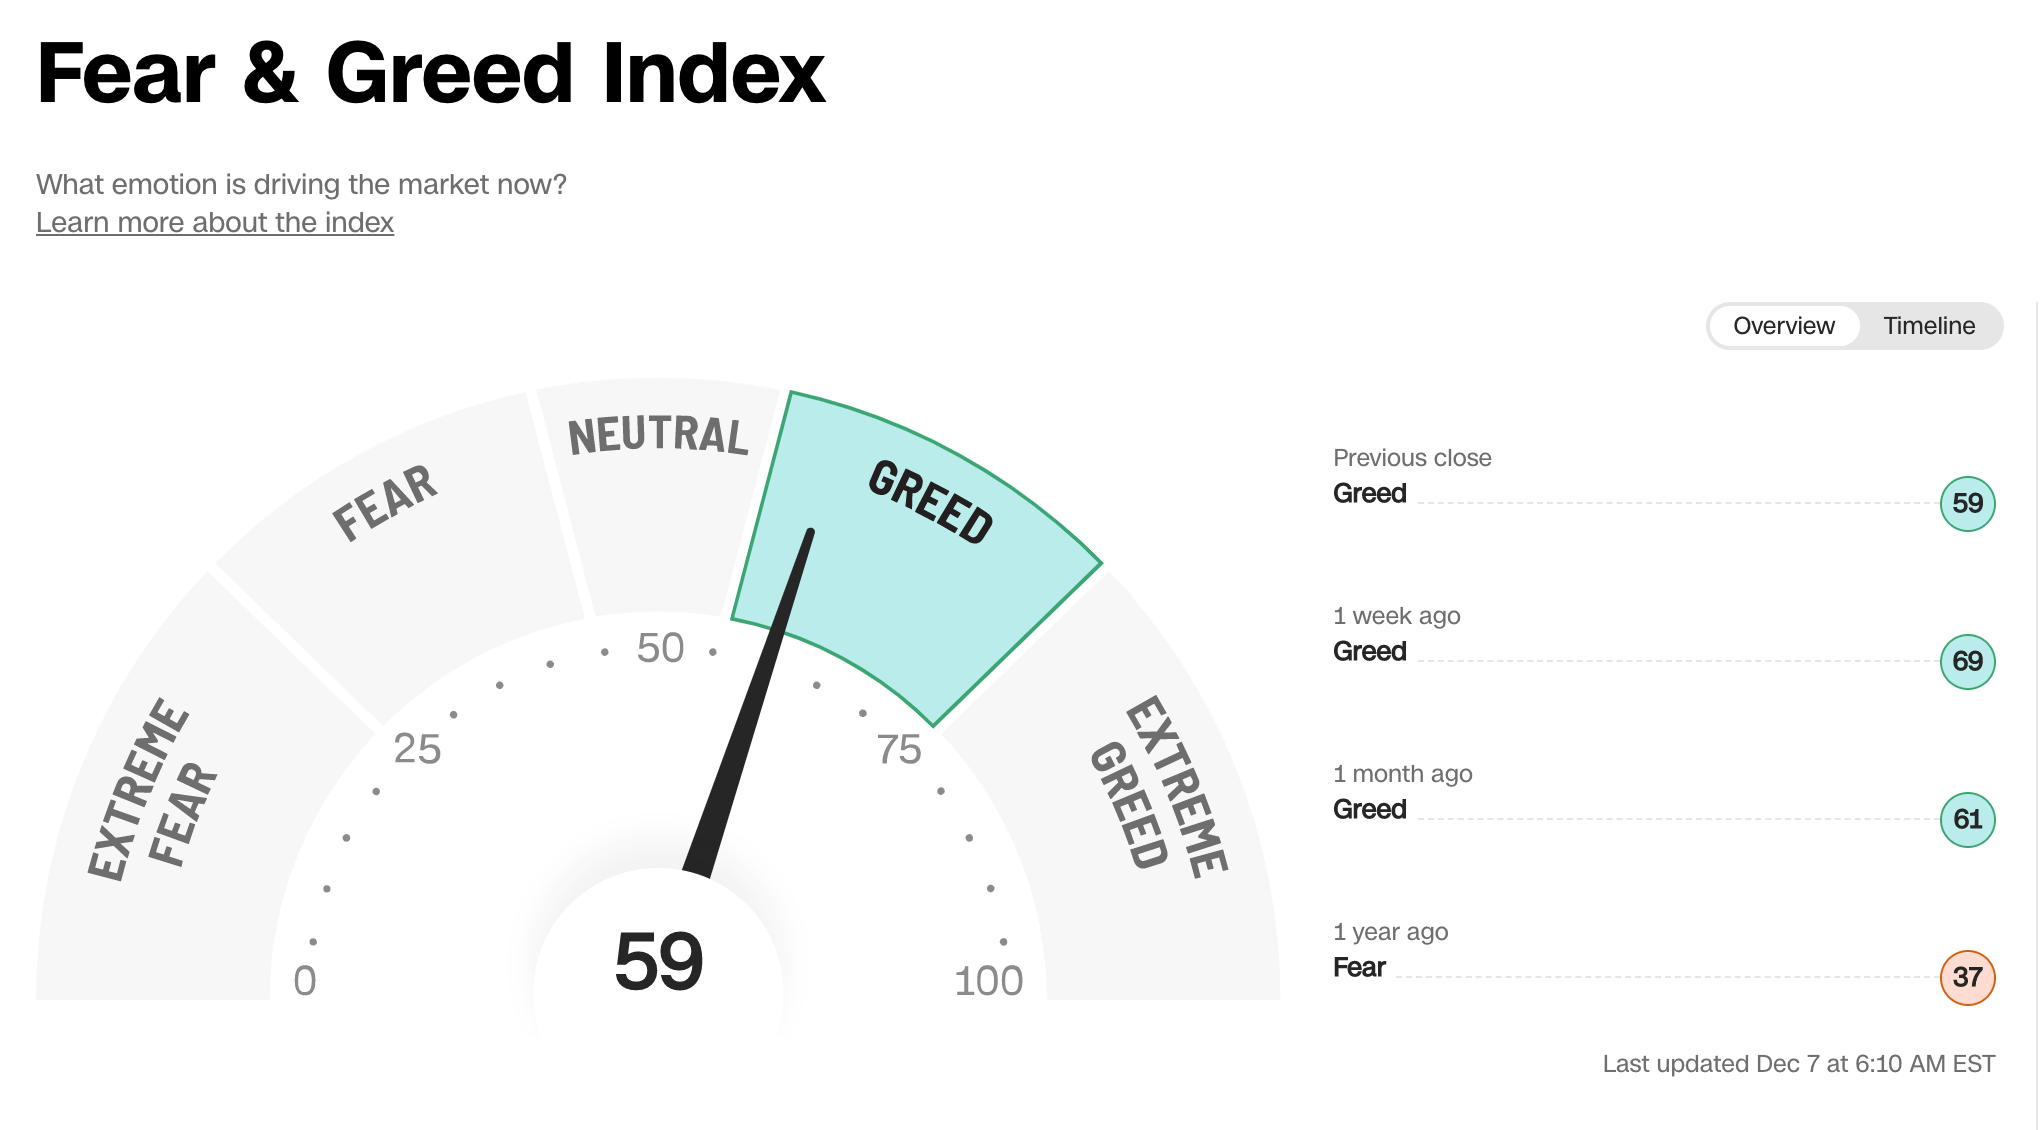
The market sentiment is at 59 in the "Greed" mode which is lower than the level registered one week ago.
FedWatch Tool - FED rates probabilities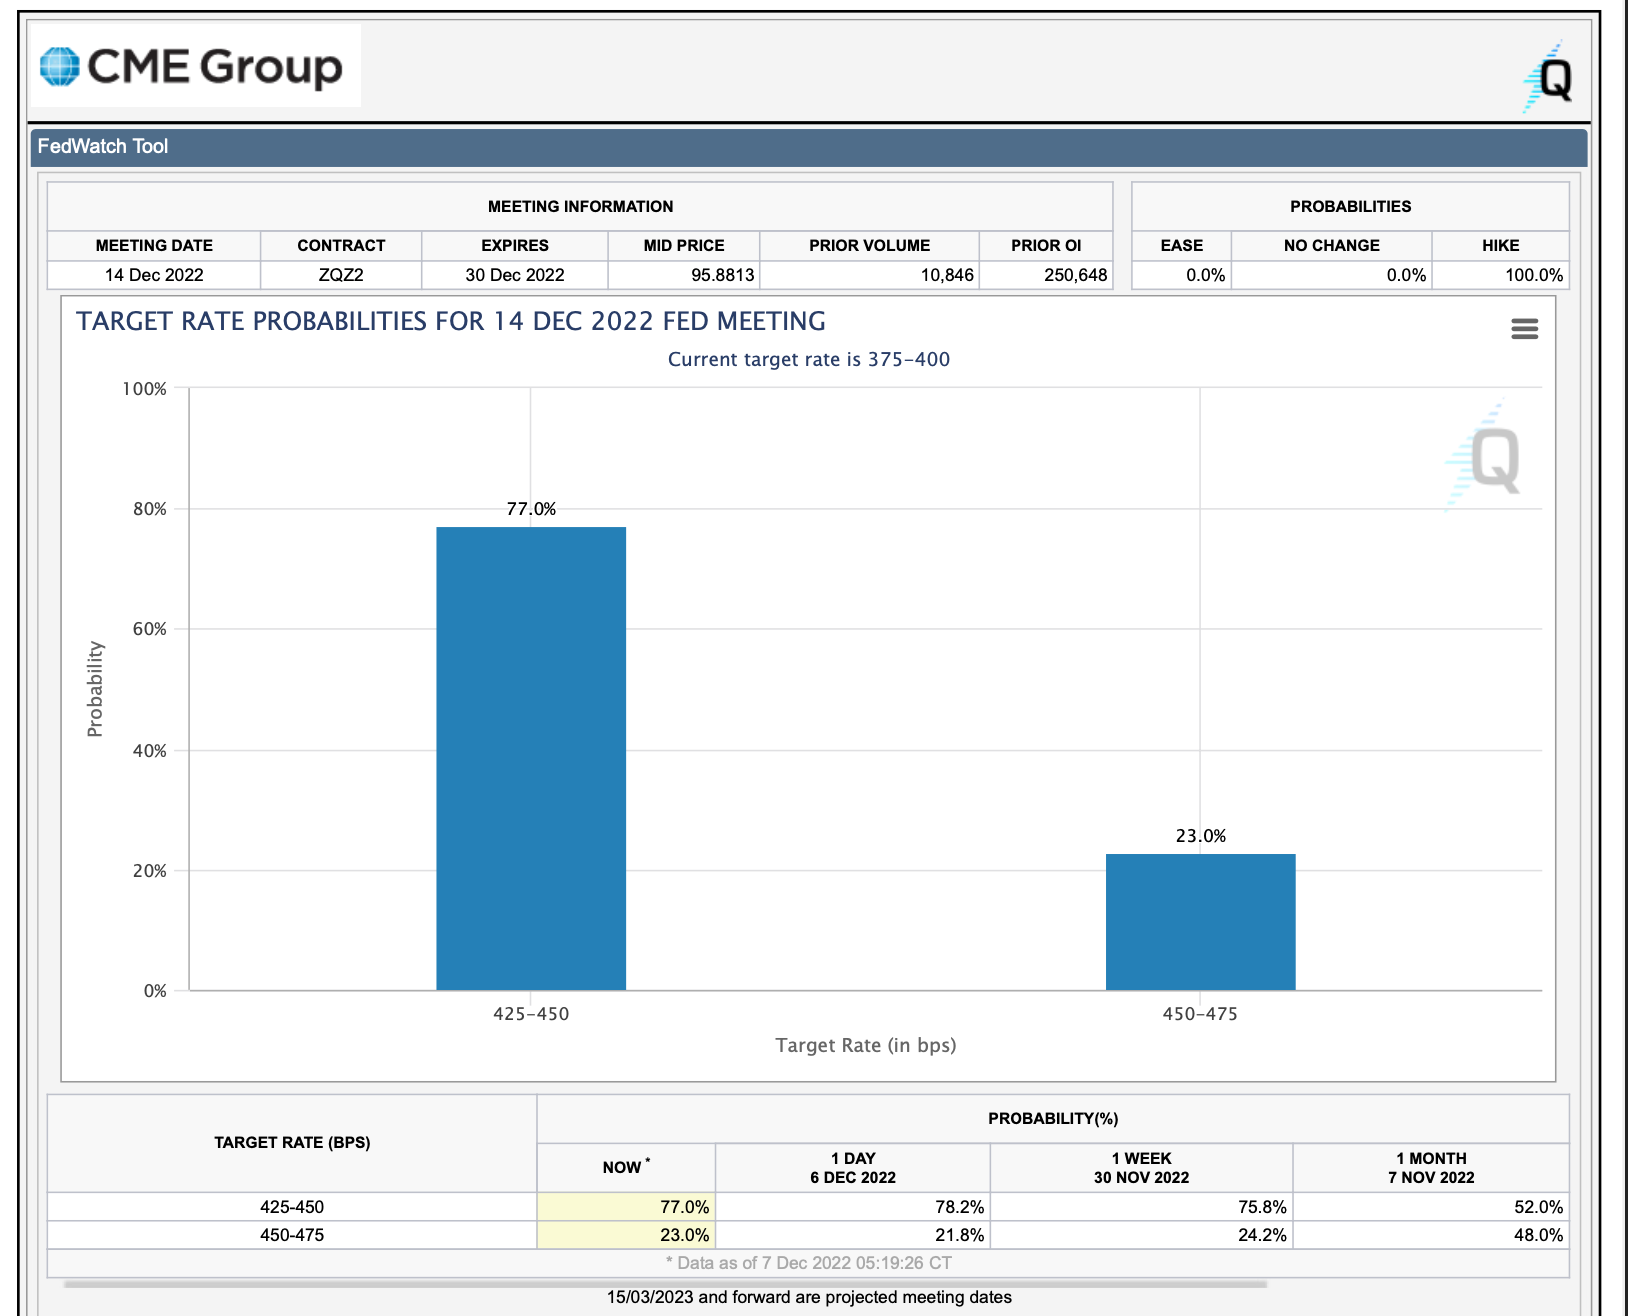
77.0% of investors are expecting the FED to increase the interest rates by 0.50% in the next meeting.
The remaining 23.0% are expecting a 0.75% rate increase.
The data show us that the number of investors expecting an increase of 0.75% is getting a little bit higher than in the previous days.
The next FED meeting is approaching next week, on 14 December 2022.
- English (USA)
- English (India)
- English (Canada)
- English (Australia)
- English (South Africa)
- English (Philippines)
- English (Nigeria)
- Deutsch
- Español (España)
- Español (México)
- Français
- Italiano
- Nederlands
- Português (Portugal)
- Polski
- Português (Brasil)
- Русский
- Türkçe
- العربية
- Ελληνικά
- Svenska
- Suomi
- עברית
- 日本語
- 한국어
- 简体中文
- 繁體中文
- Bahasa Indonesia
- Bahasa Melayu
- ไทย
- Tiếng Việt
- हिंदी
US Dollar Index will suggest the next market direction today
Published 07/12/2022, 13:09
US Dollar Index will suggest the next market direction today
3rd party Ad. Not an offer or recommendation by Investing.com. See disclosure here or
remove ads
.
Latest comments
There will be no recession in the US in 2023. Inflation is on the decline, as well as falling prices for all energy, raw materials and labor. Moreover, the Chinese economy will soon be launched and the world will begin economic growth, which has been waiting for 2 years.
thanks
I hope it helps.
Awesome analysis. Thanks a lot.
Thank you for your positive comment
Thanks really good insight.
Thank you
Install Our App
Risk Disclosure: Trading in financial instruments and/or cryptocurrencies involves high risks including the risk of losing some, or all, of your investment amount, and may not be suitable for all investors. Prices of cryptocurrencies are extremely volatile and may be affected by external factors such as financial, regulatory or political events. Trading on margin increases the financial risks.
Before deciding to trade in financial instrument or cryptocurrencies you should be fully informed of the risks and costs associated with trading the financial markets, carefully consider your investment objectives, level of experience, and risk appetite, and seek professional advice where needed.
Fusion Media would like to remind you that the data contained in this website is not necessarily real-time nor accurate. The data and prices on the website are not necessarily provided by any market or exchange, but may be provided by market makers, and so prices may not be accurate and may differ from the actual price at any given market, meaning prices are indicative and not appropriate for trading purposes. Fusion Media and any provider of the data contained in this website will not accept liability for any loss or damage as a result of your trading, or your reliance on the information contained within this website.
It is prohibited to use, store, reproduce, display, modify, transmit or distribute the data contained in this website without the explicit prior written permission of Fusion Media and/or the data provider. All intellectual property rights are reserved by the providers and/or the exchange providing the data contained in this website.
Fusion Media may be compensated by the advertisers that appear on the website, based on your interaction with the advertisements or advertisers.
© 2007-2024 - Fusion Media Limited. All Rights Reserved.