Market Overview
There has been a pick-up of sentiment in the past few days which has helped to pull a near term improvement in risk appetite. The question is whether these trends are sustainable. Better than expected Chinese services data got the ball rolling and since then we have seen reduced expectation of a chaotic Brexit, an attempt to diffuse the civil unrest in Hong Kong and now better news on the trade dispute. The US and China have agreed to meet to discuss trade in October. This has allowed bond yields to tick slightly higher (the US 2s/10s spread is currently +2bps positive), dragging on safe haven assets (gold and the yen) whilst allowing a rebound on risk (Aussie, sterling and broad equities). It has certainly taken the edge off some pretty negative sentiment across markets, but much of this is near term noise at this stage, and the sustainability of an improvement is questionable. The delivery of Brexit is still blurred between a tragedy and a farce, whilst few really expect there to be any realistic progress in the trade dispute this side of the 2020 Presidential election. For now though, there is a positive bias and several markets we cover are around interesting crossroads levels where the very near term move could gain some traction. It could be that tomorrow’s payrolls report will be the catalyst.
Wall Street closed decisively higher with the S&P 500 +1.1% at 2938, whilst US futures are a further +1.0% this morning. This has helped Asian markets to a significant bounce of Nikkei +2.2% and Shanghai Composite +1.5%. In forex, there is a slight paring of yesterday’s strong gains on GBP and EUR, but AUD continues to climb in its recovery with positive risk appetite. The safe haven majors (CHF and JPY) are weaker. In commodities, the better risk environment is a drag on gold by -$7 (or around half a percent lower), whilst oil is consolidating.
There is very much of a US focus on the economic calendar today, with the delayed ISM Non-Manufacturing data top of the bill. First up is the ADP (NASDAQ:ADP) Employment change at 1315BST which is expected to slip slightly back to 149,000 in August (down from 156,000 in July). Weekly Jobless Claims at 1330BST are expected to remain at 215,000 (215,000 last week). After the surprise move into contraction of the manufacturing sector, the most important announcement is ISM Non-Manufacturing at 1500BST which is expected to improve to 54.0 for August (from 53.7 in July). US Factory Orders are expected to grow by +1.0% in the month of July (after growing +0.6% over the month of June). Another data delayed over from Wednesday are the EIA oil inventories at 1600BST where crude stocks are expected to again be in drawdown by -2.6m barrels, whilst distillates inventories are expected to have built by +0.5m barrels and gasoline stocks expected to have drawn down by -1.6m barrels.
Chart of the Day – AUD/USD
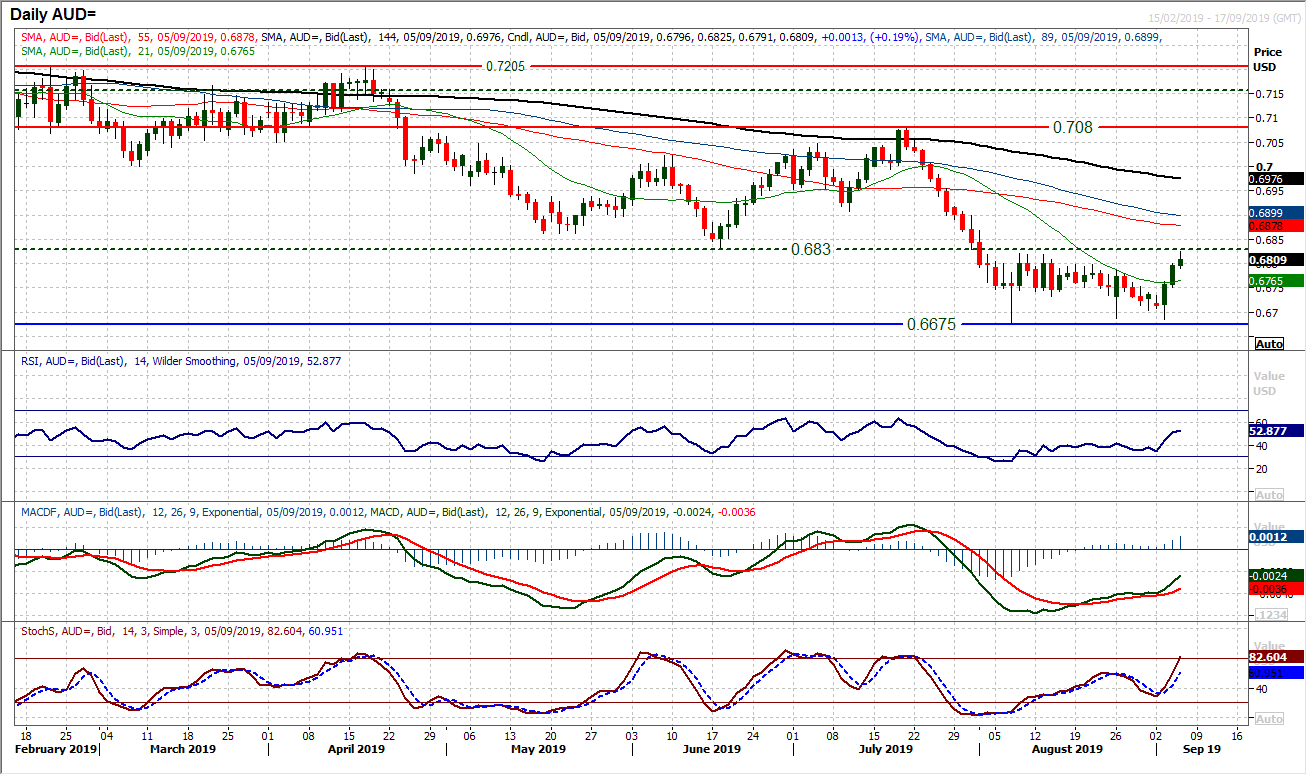
After weeks of negative bias on the Aussie versus the US dollar, a sudden shift in sentiment is showing through. The question is whether this is a sustainable move. The market has been bearishly moving lower through the past six weeks, but a big bullish engulfing candlestick (bullish key one day reversal) posted on Tuesday has signalled the change. The fact that this is not an isolated signal is encouraging for a potential recovery now. There is a range of bullish divergences on momentum indicators which show that the selling pressure has been running out of steam in recent sessions and the market is ripe for a rally. A bullish divergence with a (positive) failure swing has formed on RSI, whilst MACD lines show a similar positive divergence but also now have a bull kiss too. A second positive candle yesterday adds to the improving outlook. However, the key test for the bulls lies ahead with the overhead supply and resistance in the band $0.6820/$0.6830. This needs to be overcome to suggest there is traction in a recovery. Until then, the move could simply be playing out as part of a rectangle consolidation between $0.6675 and $0.6820. Effectively therefore a closing break above $0.6830 would complete a base pattern and imply around 150 pips of additional recovery. The hourly chart shows initial support $0.6750/$0.6770 needs to hold to maintain the recovery momentum.
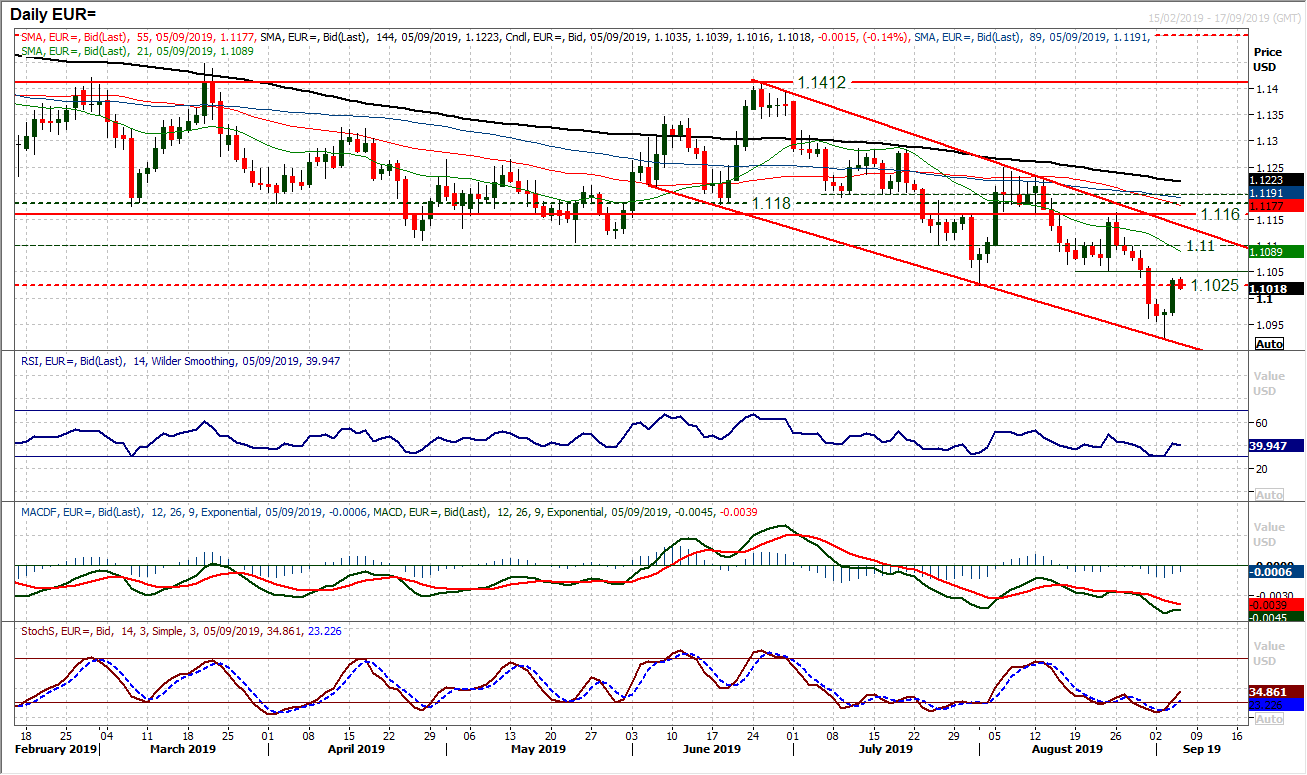
The euro rally has engaged well in the past 36 hours, but there is much more for the bulls to do for this move to be sustainable. The real test lies in the next couple of sessions. A knee jerk reaction higher has been seen, but one which has simply pulled the market up to the overhead supply of the $1.1025/$1.1050 old key lows of August. We see EUR/USD is now trading within a downtrend channel and with all momentum indicators still negatively configured, for now this is just another bear market rally for the euro. There is considerable resistance overhead but there is scope for an unwind within the channel resistance, which comes in today around $1.1140. Yesterday’s sharp positive candle added around 60 pips to Tuesday’s bull hammer candlestick and suggests the bulls have the recovery momentum with them. This needs to be maintained, with the hourly chart showing a basis of support $1.1020/$1.1000 now. A failure in the $1.1025/$1.1050 band with a close back under the psychological support at $1.1000 would be disappointing for the bulls now. The key low is at $1.0925.
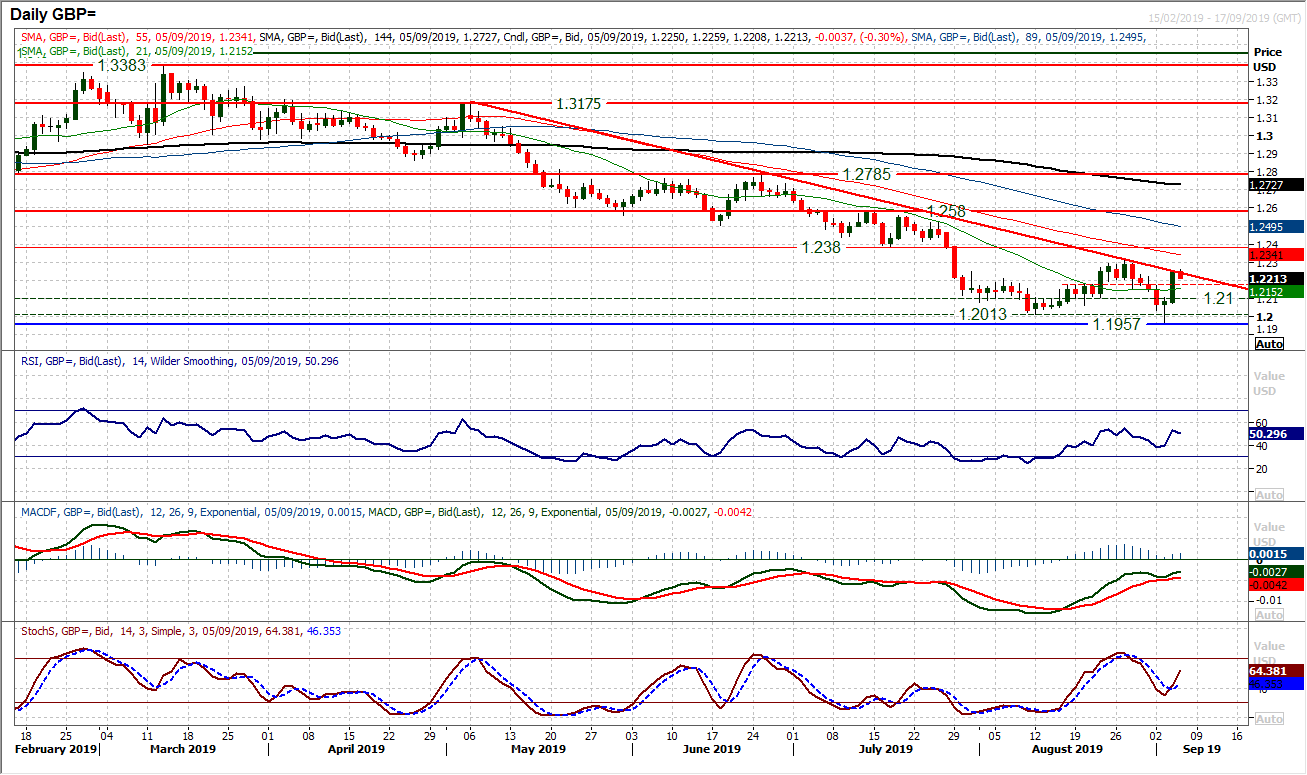
We discussed yesterday the prospect of a near term rally and this really took off yesterday with a bull candle that added 165 pips to Cable. The move has instantly now brought the market up for a test of the big four month downtrend. The technicals had already been improving with the bull hammer, but they are really responding to this move now. This is especially the case with the bull kiss on the MACD lines, whilst Stochastics have bull crossed higher and RSI is above 50 again. Throughout recent months, technical rallies have faltered between 52/54 on RSI. Cable is at a crossroads and is testing this big downtrend today, but the key resistance is at $1.2307. There has not been a key lower high broken on GBP/USD since March and this will certainly be on the minds of the sterling bulls. We have talked previously about a short squeeze, well the market breaking above $1.2307 would be a crucial outlook changer for sterling. The hourly chart shows a potential unwinding of at least some of the gains is threatening. A band of support $1.2160/$1.2210 needs to now hold.
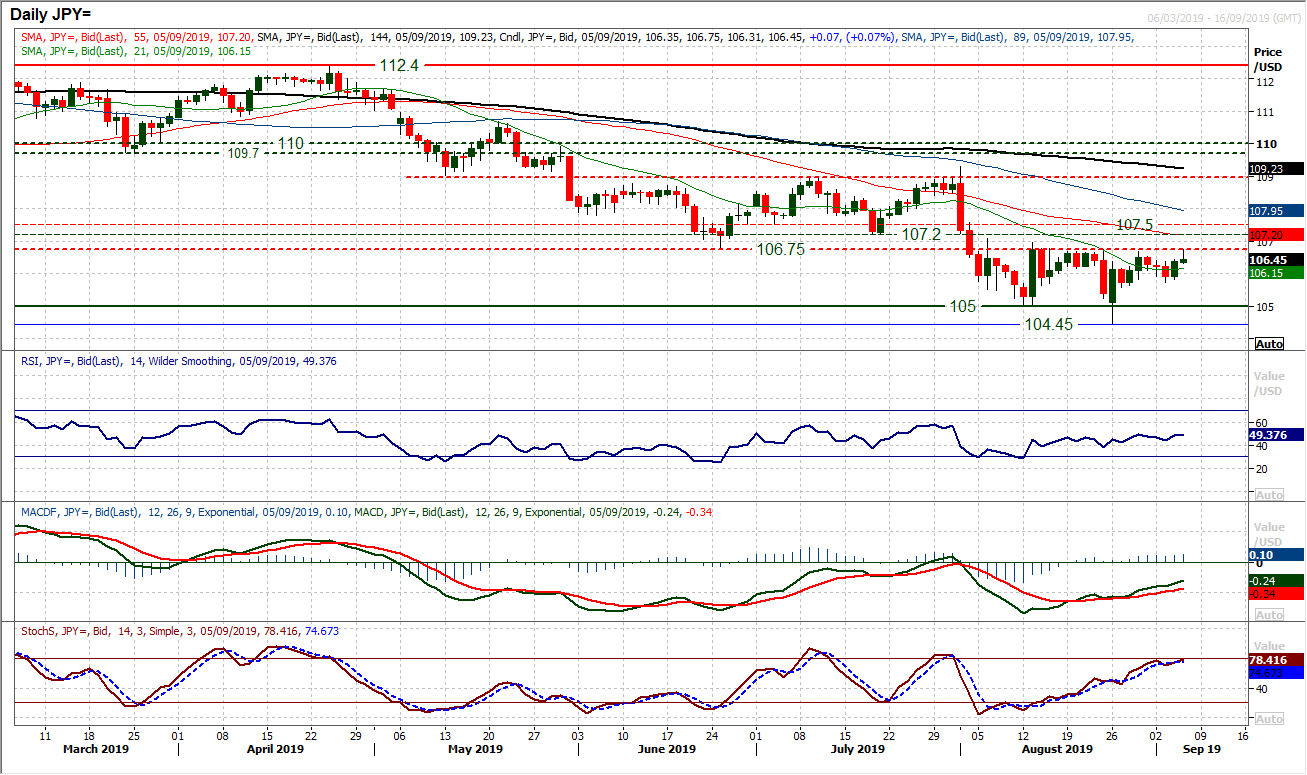
A tick higher has once more given a neutral configuration to the range of the past month. It is interesting to see that for weeks there has been a key attraction towards a test of the resistance at 106.75, but consistently this is an area of overhead supply which is seen as a chance to sell. There remains a negative bias to the medium term outlook, but there is also a drift higher on a near term basis. However, there is also a lack of traction in moves higher. The weight of the overhead supply from the old June/Jul lows between 106.75/107.50 is considerable, and our base case is still to use rallies as a chance to sell. This would be questioned on consistent closes above 106.75 whilst above 107.50 would be decisive. Once more the market has had a look at 106.75 this morning and shied away. The support is building between 105.60/105.75.
Gold
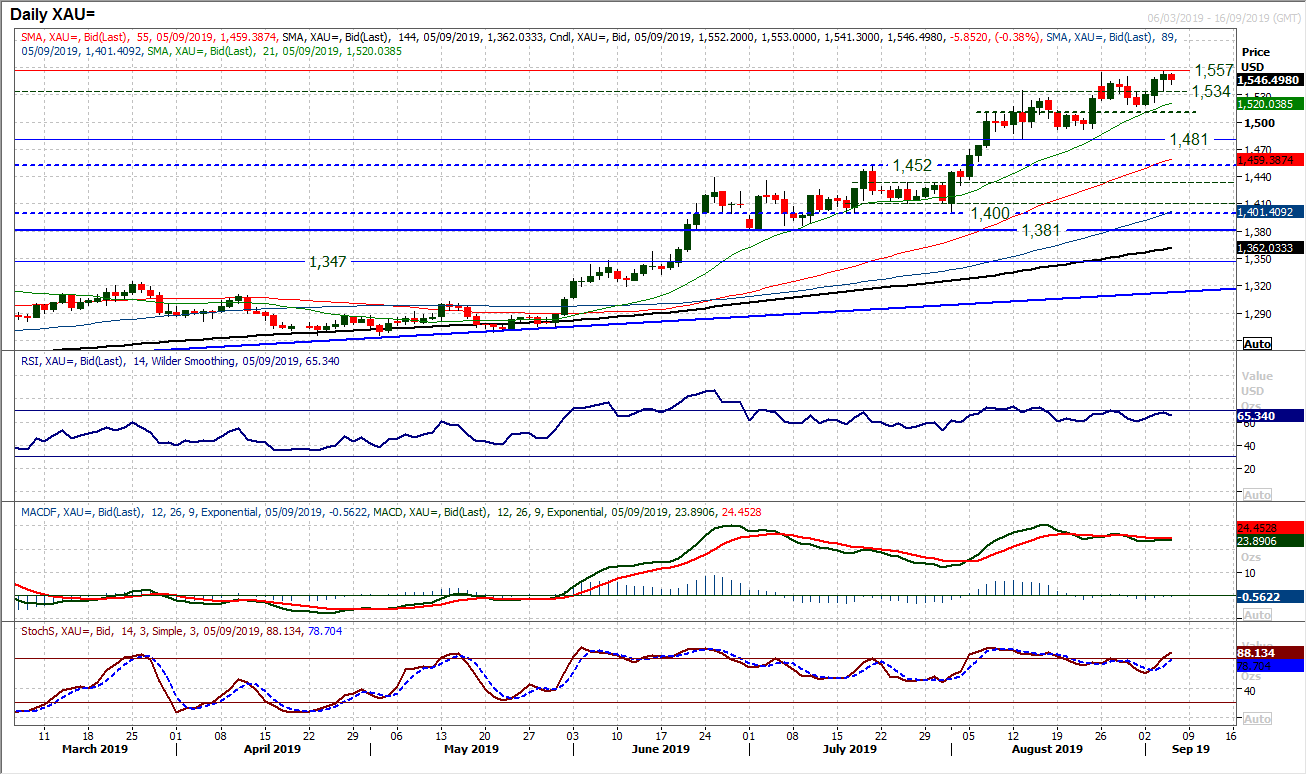
Once more the gold bulls are looking to push the market higher. There have now been two consecutive multi-year closing highs whilst yesterday breaching the $1555 previous resistance. We continue to see near term weakness as a chance to buy. Therefore, with the market looking to pullback again this morning, this should be seen as an opportunity. Momentum is strongly configured on a medium term basis and the bulls will be looking for a close above $1555 to trigger a decisive breach of the recent trading band $1517/$1555 and open the next leg higher. The hourly chart shows a pivot at $1534 as the initial basis of support to build from, with key near term support at last week’s low at $1517. The hourly chart shows positive momentum configuration, with hourly RSI consistently bottoming 35/40 and hourly MACD lines above neutral. Initial resistance now at $1557 above which really does hold very little resistance of any significance.
WTI Oil
Another swing higher with the improvement in risk appetite and the oil price is back around key near term resistance. Throughout the past few weeks, WTI has been failing between $56.90/$57.50 as the market has built a consolidation pattern ($52.80/$57.50). Momentum indicators have become increasingly neutral with RSI, MACD and Stochastics all hovering around their neutral points. However, this is all playing out under the four and a half month downtrend which comes in around $57.15 today. We continue to favour selling into the strength and will do until the market decisively breaches the first key lower high at $58.80. The hourly chart shows initial support $54.80/$55.30.
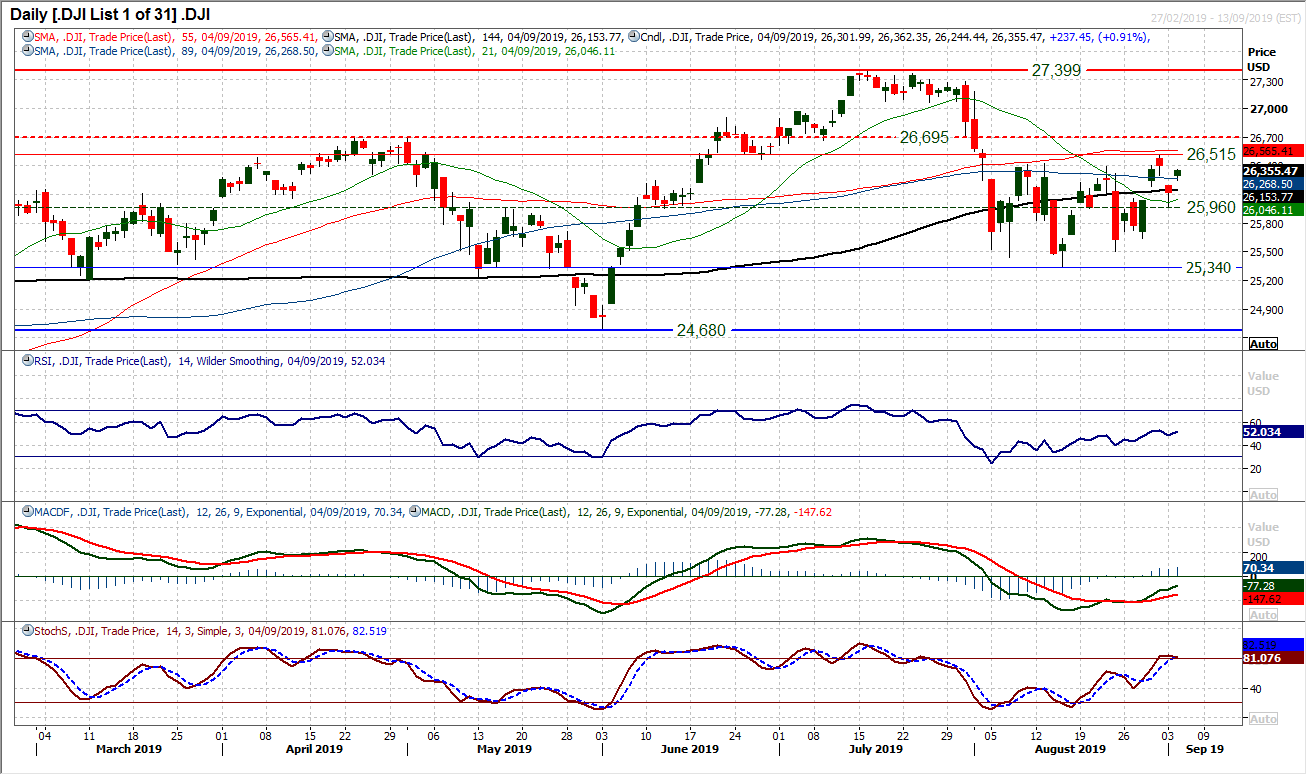
The Dow has turned higher once more to put the bulls in the box seat for finally breaking free of the consolidation of the past month. There has been considerable uncertainty over which way the eventual break would come from this range between what is now 25,340/26,515. However, in recent sessions the bulls have begun to gain in confidence. In the past week there has been a push higher on RSI above 50, whilst MACD lines have crossed higher and Stochastics have moved into bullish configuration. Gaps on the Dow are frequent, but with Tuesday’s session filling last week’s gap higher (positive) another gap higher yesterday suggests the bulls are ready to go. Futures are showing around 1% higher at the open which would be a breach of Friday’s high at 26,515 which caps the range. A closing breakout would effectively complete a 1170 tick base breakout which would imply a retest of the 27,399 all-time high again. For this move be sustainable, needs RSI above 60 and MACD lines above neutral in the least. Initial support at 26,245 with 25,980 now a potential key higher low.
"""DISCLAIMER: This report does not constitute personal investment advice, nor does it take into account the individual financial circumstances or objectives of the clients who receive it. All information and research produced by Hantec Markets is intended to be general in nature; it does not constitute a recommendation or offer for the purchase or sale of any financial instrument, nor should it be construed as such.
All of the views or suggestions within this report are those solely and exclusively of the author, and accurately reflect his personal views about any and all of the subject instruments and are presented to the best of the author’s knowledge. Any person relying on this report to undertake trading does so entirely at his/her own risk and Hantec Markets does not accept any liability. """
