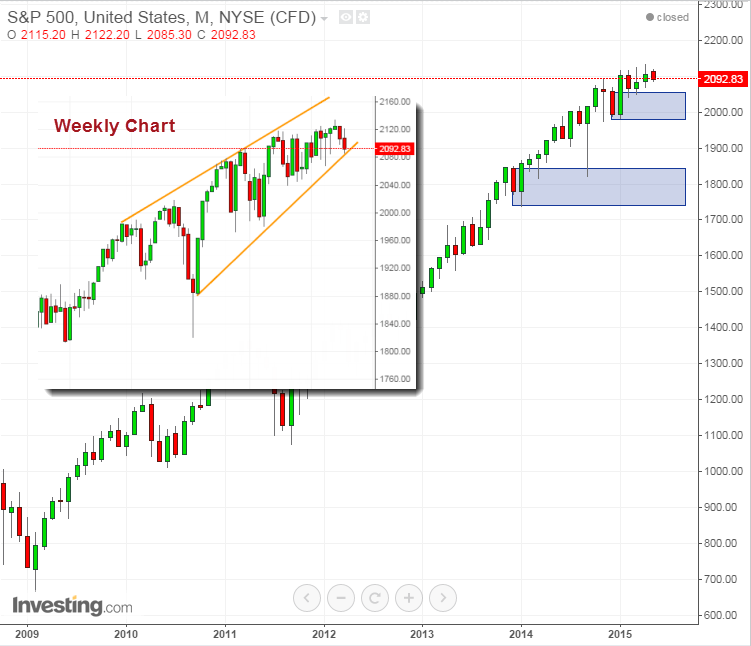
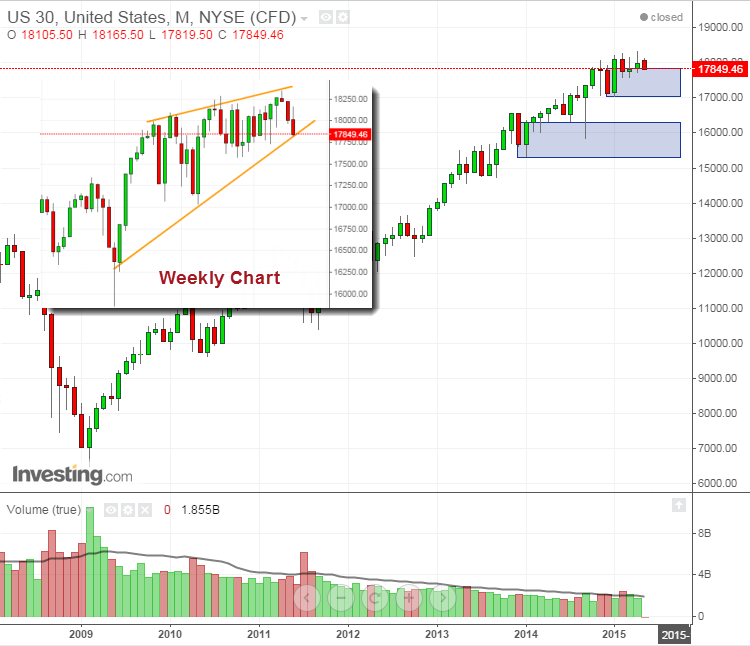
Last week’s better-than-expected US employment data – the Nonfarm Payrolls and Average Hourly Earnings reports – took more air out of the already thin atmosphere surrounding the US indices. The S&P 500 lost around 0.7% and the Dow Jones Industrial Average (DJIA) lost 0.9%. The S&P 500 has been moving sideways around the 2100 level since February this year, while the DJIA has been struggling with the 1800 level since December 2014. January's monthly candle formed a fresh monthly demand zone, which is still holding, but the price has so far not managed to go much above it.


Both indices have been moving in tight ranges during this time, forming a rising wedge—a bearish pattern. The expectation of an interest rate hike by the Federal Reserve later on this year, along with contradicting economic data in recent months, have held investors back, while leaving them with ongoing tense uncertainty.
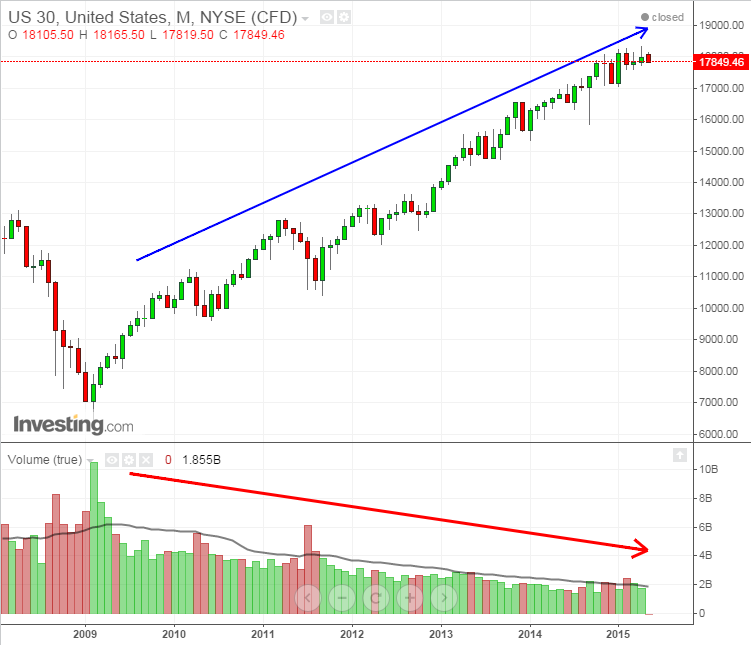
This uncertainty can be seen in the charts via narrowing ranges and a divergence between rising prices and falling volume. This is clearly illustrated in the DJIA monthly chart below. Notice how the volume in recent months has dropped to only one fifth of the volume that existed at the beginning of this long uptrend, six years ago:

The foundations of modern technical analysis were laid by Charles Dow, the founder and first editor of The Wall Street Journal and the co-founder of Dow Jones and Co. His followers constructed the “Dow Theory”, which includes six basic tenets, among which are:
- A market trend has three phases: accumulation by early buyers (savvy investors); participation by trend followers (the masses); distribution by early sellers (savvy investors). The accumulation phase of the post-2008-crisis was very short – hence the V-shape at the beginning of 2009. The participation phase has started shortly after. Are we in the distribution phase? Time will tell, but as the price range keeps narrowing, the countdown is nearing its end.
- Trends are confirmed by volume: Dow believed that high volume is solid proof of the real market view, while low volume in an uptrend could point to the existence of strong sellers. Volume has been decreasing for many months, while the indices have shown significant gains, but now that price movement has lost its momentum, it needs more volume to regain power.
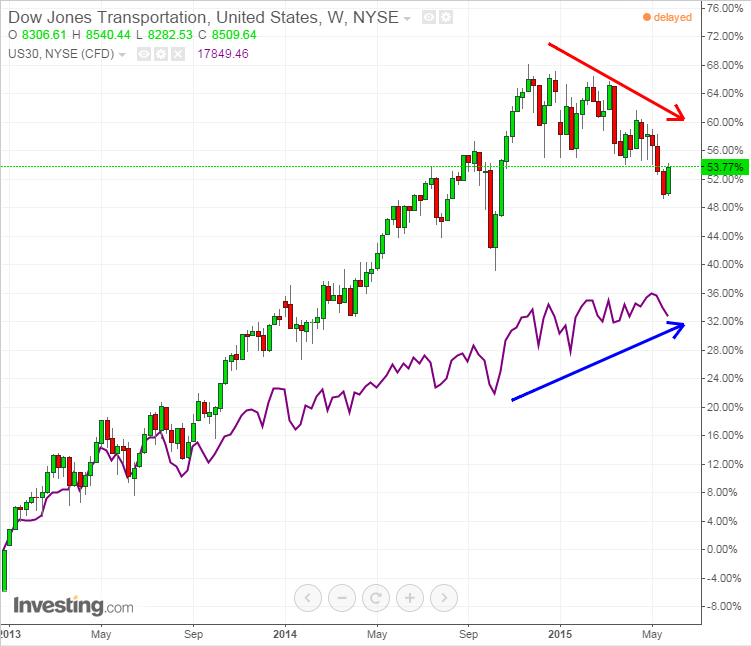
- Stock market averages must confirm each other: Dow lived in the industrial era, and he followed mostly industrial companies. Dow logically deduced that, if manufacturers’ profits were growing, it meant they are manufacturing more, and therefore shipping more – hence transportation companies should show growing profits concurrently. This assumption continues to hold true even though we're now living in a time which many consider to be the post-industrial era. But over the last few months, the Dow Transportation Index has been negatively diverging from the Dow Jones Industrial Average. For Charles Dow this was a warning sign.

- Trends exist until definitive signals prove otherwise: the markets can temporarily move in opposite directions and create minor counter-trends, but the major trend is still valid.This is the major “but” here. So far, there haven’t been any definitive signals that prove that the rising trend has ended. The narrowing ranges could breach up, the rising wedges have not yet been confirmed, the monthly demand zones are holding steady below, and so far no major supply zones or persuasive bearish price action has taken place.
Are the bears ready to end their long hibernation? Have the bulls gotten tired from their six-year climb? Charts will tell…
