NAGA Group AG (DE:N4G) continues to benefit from retail investor activity and volatility in financial markets, further underpinned by its social trading functionalities (trade copy feature in particular). Consequently, after completing its restructuring in FY19, NAGA posted a positive EBITDA and a small net profit in FY20, with management now guiding to robust FY21 sales of €50–52m (€24.5m was already generated in H121) and EBITDA of €13–15m. Recently, it also secured further funding through convertible bonds with a volume up to €25m (of which €8.0m has already been issued).
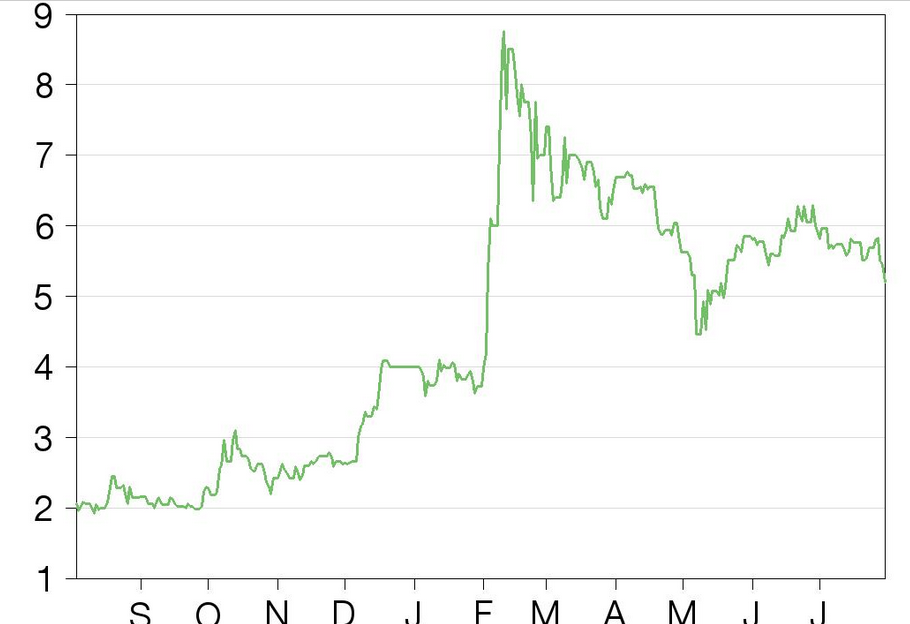
Share Price Graph

Strong FY20 trading driving earnings
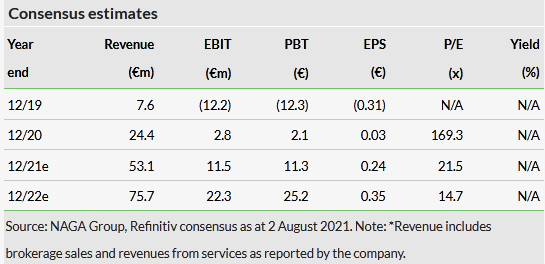
NAGA Group reported a significant increase in revenues to €24.4m in FY20 (versus €7.6m in FY19 and FY20 management guidance of €22–24m), driven by growing trading volumes (€120bn in FY20 versus €41bn in FY19). An improved gross margin (93.8% versus 74.3% in FY19), coupled with lower personnel expenses (down 10% y-o-y to €4.1m) as a result of earlier restructuring, helped NAGA reach an EBITDA of €6.6m (versus a loss of €9.2m in FY19). Earnings per share excluding minorities stood at a minor positive €0.03 after a €0.31 loss in FY19. The company’s net debt excluding restricted cash stood at €4.8m at end-2020 (versus €3.4m), implying a moderate net debt to EBITDA ratio of 0.7x.
Growth from foreign expansion and new products
NAGA Group aims at fulfilling its growth ambitions through maintained focus on core competencies in the online brokerage business, further development of customer support to drive user satisfaction and growth in customer base, and continued high level of IT and product innovation. Major potential growth catalysts are international expansion (in particular beyond European markets), as well as new products, including NAGA Pay (a mobile banking and investing app) and NAGA Pro (a service for ‘digital influencers’).
Valuation: FY21 and FY22 growth seems priced in
NAGA’s FY21e and FY22e EV/EBITDA of 14.9x and 9.4x (based on Refinitiv consensus) represents a 2% discount and 7% premium to peer group median. This suggests its current valuation discounts a continuation of high earnings momentum into FY22. Its FY21e and FY22e EV/sales multiples of 4.1x and 2.9x imply a 4% premium and a 10% discount to peer group, respectively.

Financials: High user activity in FY20
NAGA’s revenues increased significantly in FY20 to €24.4m from €7.6m in FY19, slightly exceeding management guidance of €22–24m published in July 2020. This was assisted by a visible growth in trading volumes (€120bn in FY20 versus €41bn a year earlier) amid increased volatility during the COVID-19 pandemic and ongoing expansion of the business supported by NAGA’s marketing activities. NAGA’s customer base increased 72% y-o-y to 43.6m users at end-2020, with the average number of active users per month more than doubling to 10,549k versus 5,090k in FY19. Moreover, NAGA’s assets under management reached €21.8m versus €17.6m in FY19. NAGA’s growth has been assisted in particular by its trade copy offering, which stimulates user activity while reducing customer acquisition costs and client churn.
Meanwhile, direct expenses related to trading revenues and trading costs associated with hedging the trades grew in aggregate by 27% y-o-y to c €3.5m, translating into a gross profit margin of c 93.8% in FY20 compared to 74.3% in FY19. NAGA’s development expenses stood at €2.5m in FY20, representing c 10.3% of its revenues (22.5% in FY19), mostly aimed at expanding functionalities and enhancing the stability of the Naga Trader app and web application, as well as developing the NAGA Pay app. NAGA capitalised c €2.0m of these expenses, including €1.6m attributable to Naga Trader and c €0.4m to NAGA Pay. The company spent €6.6m on marketing and advertising in FY20 (versus €2.5m in FY19 amid restructuring), focused on non-European markets, while personnel expenses declined by 10% y-o-y to €4.1m as a result of cost optimisation. Consequently, NAGA’s EBITDA reached €6.6m versus management’s FY20 guidance of €5.5–6m and a loss of €9.2m in FY19. At the same time, its operating cash flow improved to €3.7m in FY20 from a negative €2.4m in FY19. NAGA’s net income excluding minorities stood at €1.3m (versus a €12.0m loss in FY19).
Click on the PDF below to read the full report: