Global equities rose 12.3% in 2020, modestly above their 11.8% average annualised return.[i] Based on those returns alone, it seems like a good, easy year for investors, right? But that was far from the reality, as many investors struggled to stay disciplined and remain invested through immense market volatility. Those who reacted to 2020’s record-fast, lockdown-driven downturn by exiting the market risked missing its surprisingly swift rebound. Even investors who endured the roller-coaster year were likely tempted to ditch equities at times. Interestingly, to future data analysts, the calendar-year return just shows a nice “average” year. Fisher Investments UK believes this illustrates a valuable lesson for long-term investors: Capturing equities’ long-term average returns often requires enduring strong bouts of short-term price fluctuations.
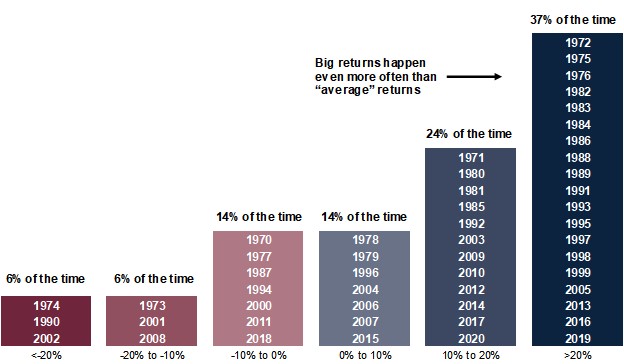
Whilst equities’ may average over 11% annualised gains over the long term, year-to-year returns may vary drastically. Since its creation in 1969, the MSCI World Index has returned between 5% and 15% in only 10 calendar years.[ii] However, as shown in Exhibit 1, the index delivered over 20% returns much more often—in 19 calendar years.[iii]
Exhibit 1: Average Returns Aren’t Normal

Source: FactSet, as of 26/04/2021. MSCI World Total Return Index, yearly, 31/12/1969–31/12/2020. Presented in GBP.
Stocks also declined in 13 calendar years, which serves as an important reminder: equities’ relatively high long-term average returns include strongly positive gains during bull markets—extended periods of rising stocks—and significantly negative returns during bear markets—fundamentally driven market downturns surpassing -20%. They experience extremes on both ends. Historically, extreme year-to-year swings often clump around the ends of bear markets and subsequent early bull-market bounces. For example, in 2002—the last year of the Tech-bubble downturn—the MSCI World fell -27.6%, just before it climbed 19.7% in 2003.[i] After the next downturn, a similar story takes place. In 2008, global equities fell -17.9% and then rose 15.7% in 2009.[ii]
Further, market corrections—short, sentiment-driven downturns of roughly -10% to -20%—are common within bull markets and can come and go for any or no reason at all. Just within the previous bull market cycle from 2009 to 2020, markets experienced numerous corrections. As an example, from December 31, 2015 to February 11, 2016 markets dropped -9.7% as investors fretted things like tanking oil prices and European bank issues.[iii] However, equities gained steam shortly after and ended up delivering a strong 28.2% full-year return in 2016.[iv] Whilst that looks like an easy year to be an investor in hindsight, it required steely nerves and discipline to endure a tough start to the calendar year.
Corrections like this one help illustrate how unpredictable equities can be in the short-term. In our view, reacting to these equity market swings is often a dangerous choice because you risk missing stocks’ long-term returns. Selling out during a downturn to avoid further pain may feel like the comfortable choice, but it can be incredibly costly and put your long-term financial health at risk if you sell after equities have fallen and miss the subsequent rebound.
Whilst news headlines tend to sensationalize equities’ near-term wiggles, accepting volatility as an inherent feature of equity investing can help you stay calm during tough periods and increase the probability of reaching your long-term financial objectives. Investors requiring equity-like growth often need to refrain from reacting and, instead, take a longer-term perspective consistent with their goals. Making strategic portfolio changes to avoid equities’ short-term volatility risks derailing your long-term plan.
Equities’ impressive average long-term returns can mask the inherent volatility associated with achieving that average. Fisher Investments UK believes investors who prepare themselves to weather equities’ sometimes extreme short-term movements—both to the upside and downside—will have a better chance of sticking to their long-term investment strategies when markets seemingly go haywire.
Follow the latest market news and updates from Fisher Investments UK:
Facebook: https://facebook.com/FisherInvestmentsUK/
Twitter: https://twitter.com/FisherInvestUK
LinkedIn: https://www.linkedin.com/company/fisher-investments-uk
Fisher Investments Europe Limited, trading as Fisher Investments UK, is authorised and regulated by the UK Financial Conduct Authority (FCA Number 191609) and is registered in England (Company Number 3850593). Fisher Investments Europe Limited has its registered office at: Level 18, One Canada Square, Canary Wharf, London, E14 5AX, United Kingdom.
Investment management services are provided by Fisher Investments UK’s parent company, Fisher Asset Management, LLC, trading as Fisher Investments, which is established in the US and regulated by the US Securities and Exchange Commission. Investing in financial markets involves the risk of loss and there is no guarantee that all or any capital invested will be repaid. Past performance neither guarantees nor reliably indicates future performance. The value of investments and the income from them will fluctuate with world financial markets and international currency exchange rates.
[i] Source: FactSet, as of 26/04/2021. MSCI World Total Return Index, yearly, 31/12/1969–31/12/2020. Presented in GBP.
[ii] Source: FactSet, as of 26/04/2021. MSCI World Total Return Index, yearly, 31/12/1969–31/12/2020. Presented in GBP.
[iii] Ibid.
[iv] Source: FactSet, as of 26/04/2021. MSCI World Total Return Index, yearly, 31/12/1969–31/12/2020. Presented in GBP.
[v] Source: FactSet, as of 26/04/2021. MSCI World Total Return Index, yearly, 31/12/2002–31/12/2003. Presented in GBP.
[vi] Source: FactSet, Inc. as of 30/04/2021; MSCI World Total Return Index, daily, 31/12/2015–11/02/2016. Presented in GBP.
[vii] Source: FactSet, Inc. as of 30/04/2021; MSCI World Total Return Index, daily, 31/12/2015–31/12/2016. Presented in GBP.
