Market Overview
Fears of a global slowdown turning into global recession triggered a swing back towards risk aversion on Tuesday. The catalyst was the ISM Manufacturing data falling to a decade low.
The key question is whether malaise in manufacturing is infecting into the dominant services sectors of major economies. Already we see worrying signs in Europe, but is this set to impact the US too. Up until now the US economy has been fairly resilient to the forces of the trade dispute and global slowdown. The US consumer has held up pretty well. However, all eyes will be on today’s ISM Non-Manufacturing data today which will give an indication of how services in the US are performing.
The FOMC’s John Williams (NYSE:WMB) (a voting centrist) talked about the US economy looking good through the rear view mirror, but mixed through the windshield. This would suggest that weaker US data along could be enough to drive any borderline centrists on the FOMC to the dovish side. Subsequently, the ISM data today and Non-farm Payrolls could be crucial. Already we have seen equities selling sharply lower, whilst investors move back into the safety of Treasuries, the yen and gold.
For now it is the dollar which is suffering, but the Eurozone is hardly a beacon of light. The WTO decision in favour of the US in a dispute with the EU over aerospace subsidies opens the way for $7.5bn of tariffs. The timing of this is clearly terrible and will add to mounting risk aversion.
Wall Street closed sharply lower last night with the S&P 500 -1.8% at 2888, whilst US futures are reflecting a degree of support early today +0.2%. However, this has not helped Asian markets which were under pressure (Nikkei -2.0%), whilst European futures are showing further downside, albeit limited, with FTSE futures -0.4% and DAX futures -0.3%.
In forex, into the Euroipean session the slide in USD looks to have been limited and possibly beginning to turn around again. However, risk aversion is still a feature as JPY is holding ground. GBP is an underperformer as EU politicians line up to give a cautious response to UK Prime Minister Johnson’s proposed Brexit deal.
In commodities, this is also meaning that gold is hovering $1500 whilst oil is mixed in early moves.
The services PMIs for September are in focus on the economic calendar today. After the raft of disappointments across the manufacturing data of major economies earlier in the week, how the services sectors are performing. The Eurozone final Services PMI is at 09:00 BST and is expected to be confirmed at 52.0 (52.0 flash, 53.5final August). This would mean that the final Eurozone Composite PMI is expected to be 50.4 (50.4 flash, 51.9 final August).
The UK Services PMI is at 09:30 BST and is expected to slip further into stagnation at 50.3 (from 50.6 in August).
US Weekly Jobless Claims are at 13:30 BST and are expected to remain around recent levels at 215,000 (from 213,000 last week). US ISM Non-Manufacturing is at 15:00 BST and is expected to drop back to a still reasonably positive 55.1 (from 56.4 in August). Also watch for US Factory Orders which are expected to decline by -0.2% in the month of August (after growth of +1.4% in July).
There are more Fed speakers today, with Randall Quarles (voter, centrist) at 13:30 BST, Loretta Mester (non-voter, mild hawk) at 17:10 BST, Robert Kaplan (non-voter, centrist) at 1800BST and Richard Clarida (voter, mild dove) at 23:35 BST.
Chart of the Day – Silver
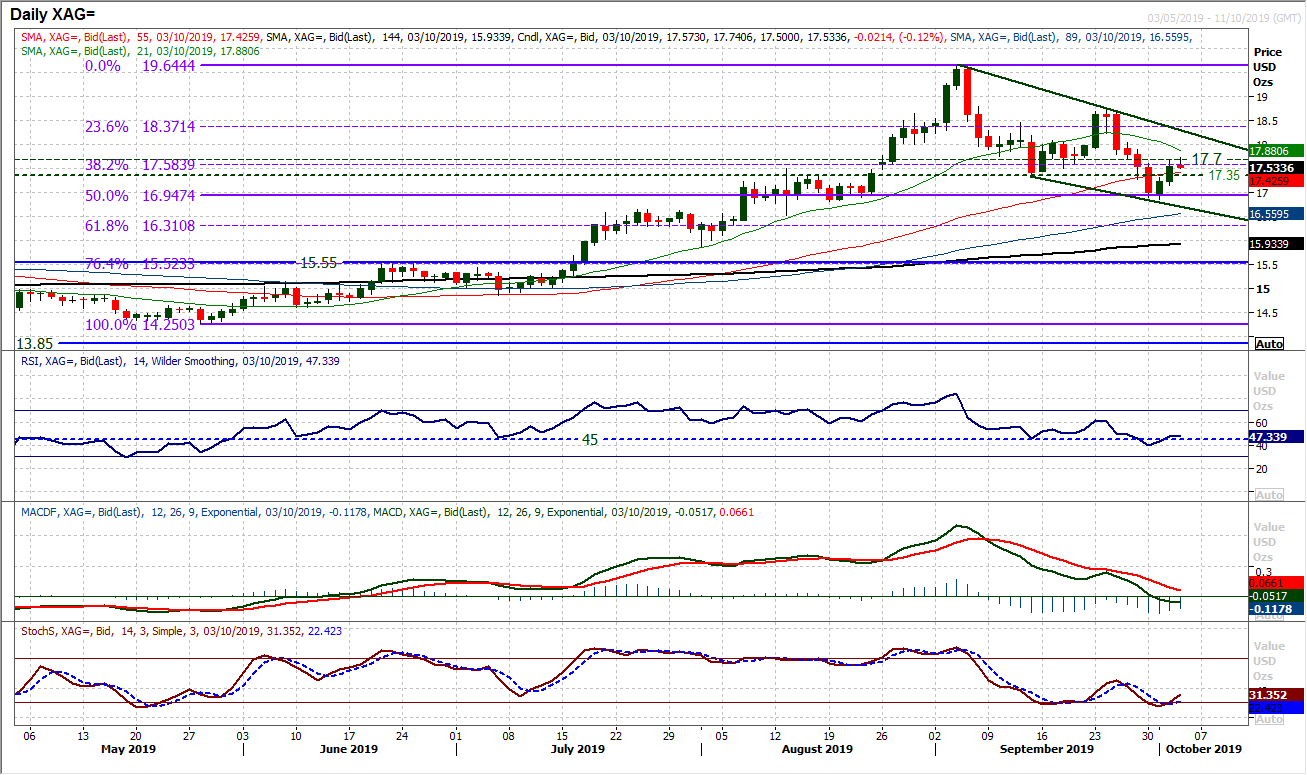
As risk appetite has continued to plunge, along with a mixed outlook for USD, the precious metals have found support to recover. But is this a near term knee jerk move? We are inclined to see this as a “bull trap”. The market has been in the process of an outlook changing deterioration over the past few weeks. There is a building corrective medium term configuration on momentum. RSI hit four month lows recently, whilst the MACD lines are also still in decline, and Stochastics too correctively configured. Despite this, there is a technical rally in process after two success positive candles. This means that the market is in the process of squeezing out short positions driven from the break below $17.35. However, there is a new trend formation of lower highs and lower lows. The question is where could this rebound go near term before what we would expect to see renewed selling pressure? There is a band of resistance $17.35/$17.70 which are old pivot levels and the old 38.2% Fibonacci retracement of $14.25/$19.64. The squeeze would accelerate if this resistance can be breached. However, the falling 21 day moving average (today at $17.88) is a good gauge for the market now. For now, silver has swung higher again as the elevated risk aversion has swept through. Once this settles down, we would expect the silver rally to falter again.
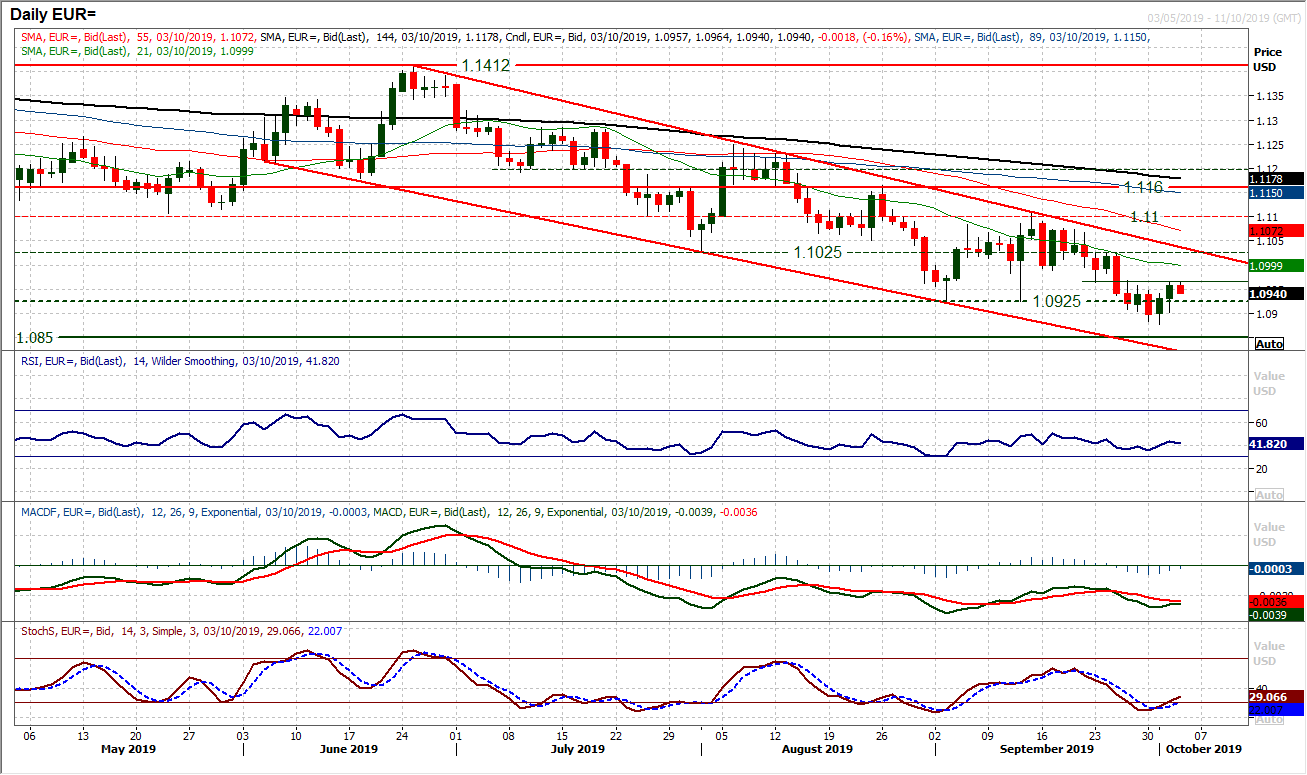
With the dollar under pressure in recent sessions, EUR/USD has managed to pull a near term recovery out. A couple of positive candles have allowed the bulls a little respite. However, we do not see this move as being the start of a sustained recovery. Instead, it is likely to be the source of the next chance to sell. Consistently over several months we have seen rallies on EUR/USD fading and sold into. Nothing has changed in this regard, yet. Momentum indicators have swung higher, with Stochastics leading the charge and RSI back above 40. However, this is all within the context of medium term negative configuration (RSI consistently under 50). The hourly chart shows key consideration being given to resistance at $1.0965 which has become a pivot line recently. It is interesting to see the hourly RSI failing at 70, whilst MACD and Stochastics lines cross lower again as the market has hit the buffers at $1.0965. A move above $1.0965 would be a positive move today for the euro, but there is plenty of overhead resistance, at $1.0990/$1.1025, the top of which coincides with the 14 week downtrend channel resistance too. Near term rallies remain a chance to sell.
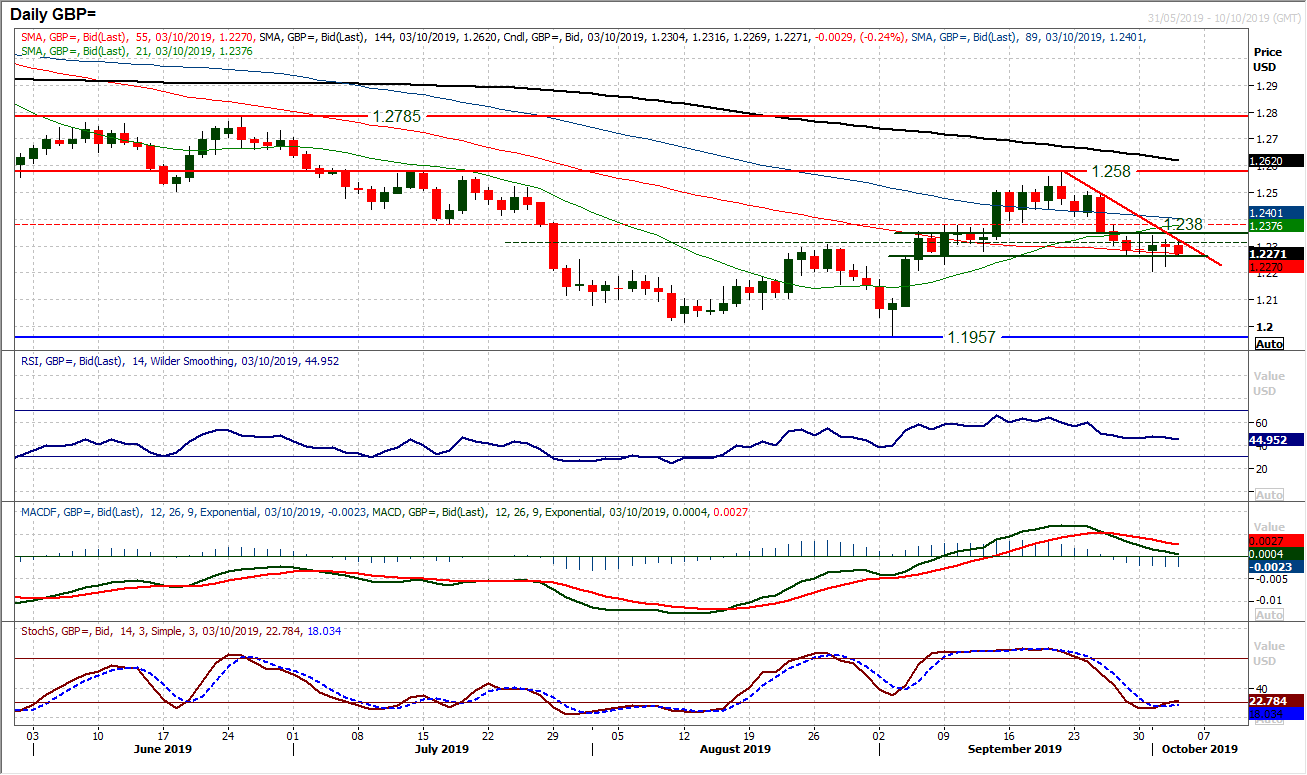
As the dollar slippage has impacted on EUR/USD and USD/JPY, Cable has been far more circumspect. We discussed the very small candlestick body of Tuesday’s session reflecting a lack of conviction in the rebound. Yesterday’s candle body was even smaller and more neutral. This comes as the market consolidates a shade under the $1.2305 neckline of the old base pattern. The hourly chart shows consolidation rather than recovery as $1.2345 resistance builds up. Hourly momentum is rangebound at best (RSI stuck under 60), however, the bulls will point to the selling pressure having been curtailed. There needs to be a move through resistance at $1.2345 preferably with a close above $1.2380 to really generate momentum in a recovery. Given the run of small bodies on the daily candlesticks, this is not something we are expecting. Support at $1.2205/$1.2225.
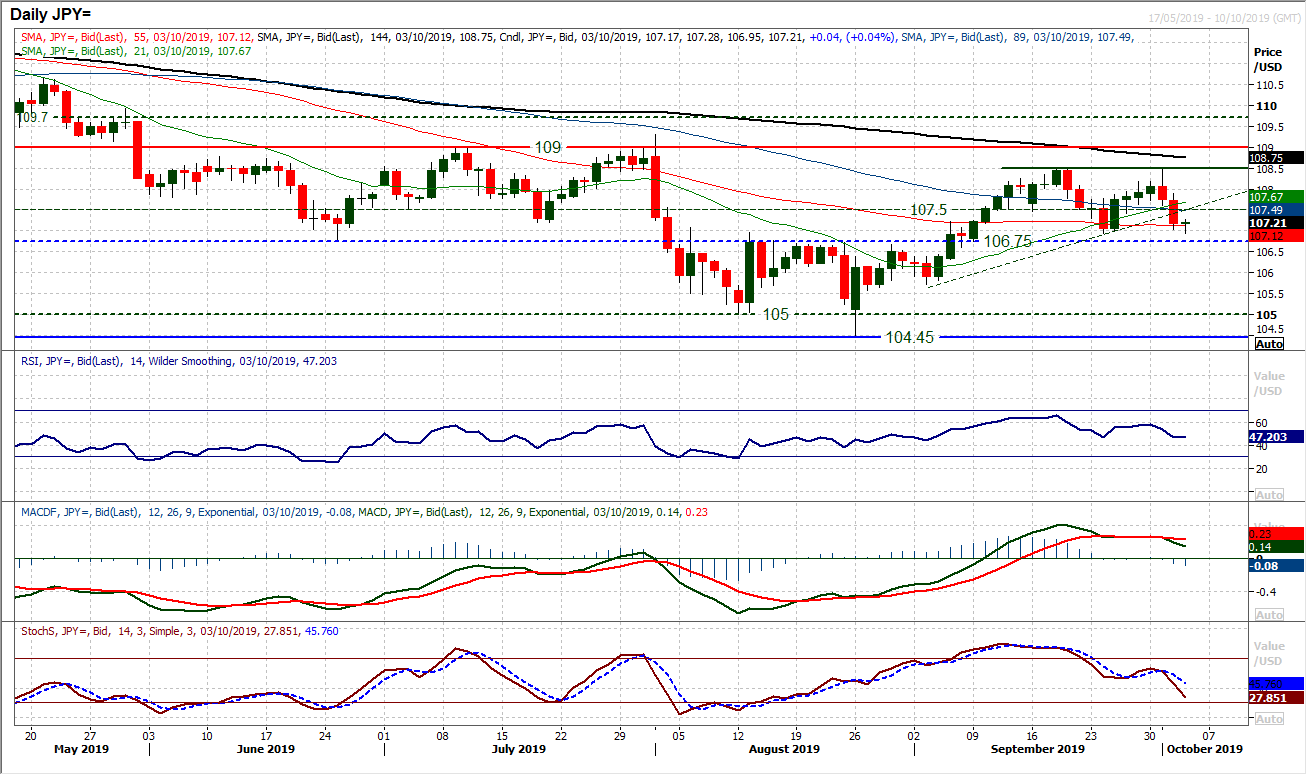
A second negative candlestick adds to the corrective near term momentum on Dollar/Yen. A retreat back to test 106.75/106.95 is subsequently playing out. This comes as a breach of a trend higher of the past month id also seen. For now we see this as a correction back towards the neckline support of the old base pattern again (at 106.75), but will have to see how this develops. Momentum has turned over and the bulls need to be far more cautious now. Stochastics (the most sensitive) are accelerating lower on the daily, whilst MACD lines are also tracking lower now. A close below 106.95 would be a four week low but also below all moving averages, hinting at further corrective momentum (effectively completing a top). The hourly chart shows resistance at 107.40/107.60.
Gold
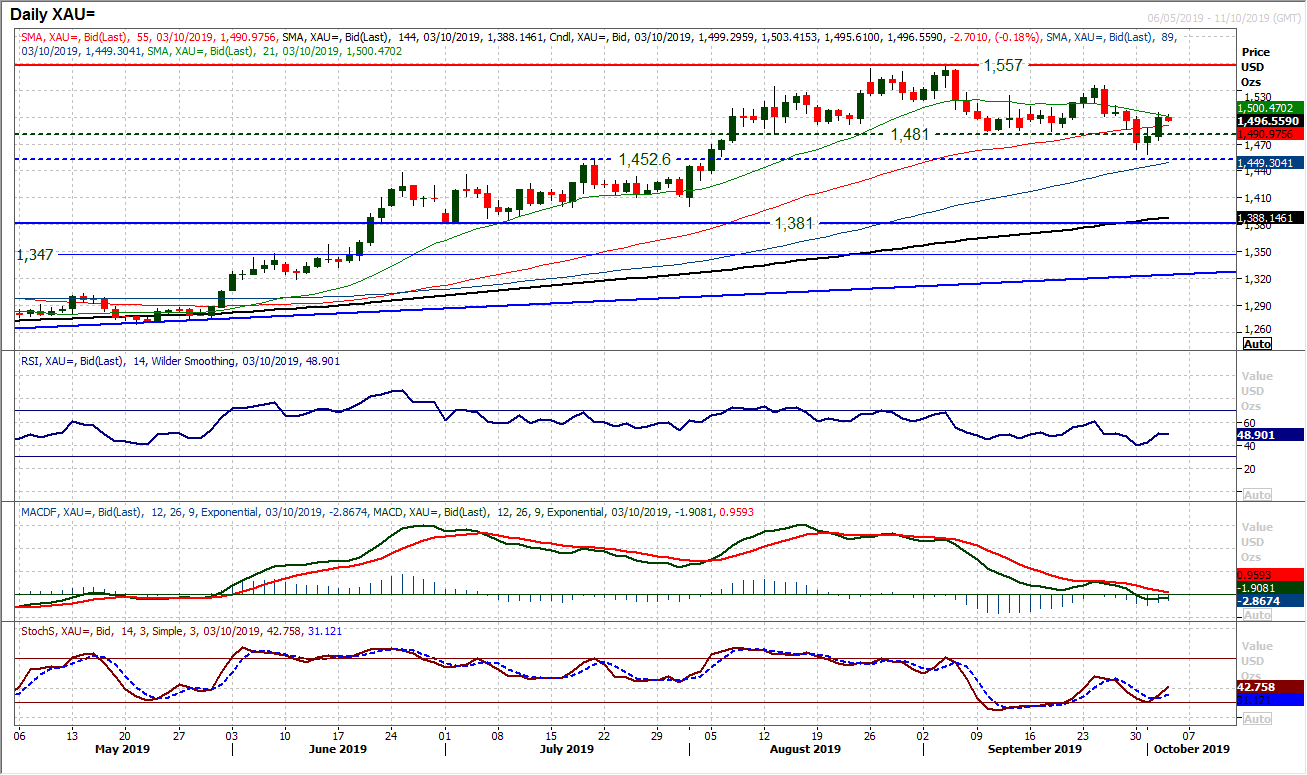
A huge couple of days in recovery mode has put the squeeze on new short gold positions. Bouncing off $1458 the market added as much as $46 in two sessions, to bring it back above the neckline at $1481. Is this a bear failure? For now, the medium term configuration of gold is still negative and this rally should be seen as a bull trap. Momentum has ticked higher on a near term basis, but the retreat into a neutral configuration (RSI between 40/60 whilst MACD lines around neutral but Stochastics correctively configured) suggests caution. With the recent completed top, we see this rebound to be short-lived and will provide the next opportunity to sell. Reaction around the 21 day moving average which is falling and has previously been a basis of resistance will be a good gauge. A failure around here (and under the pivot at $1511) would suggest the sellers regaining control. There is a basis of support around $1475/$1484 now. A close above $1511 suggests the bulls are back in the driving seat.
WTI Oil
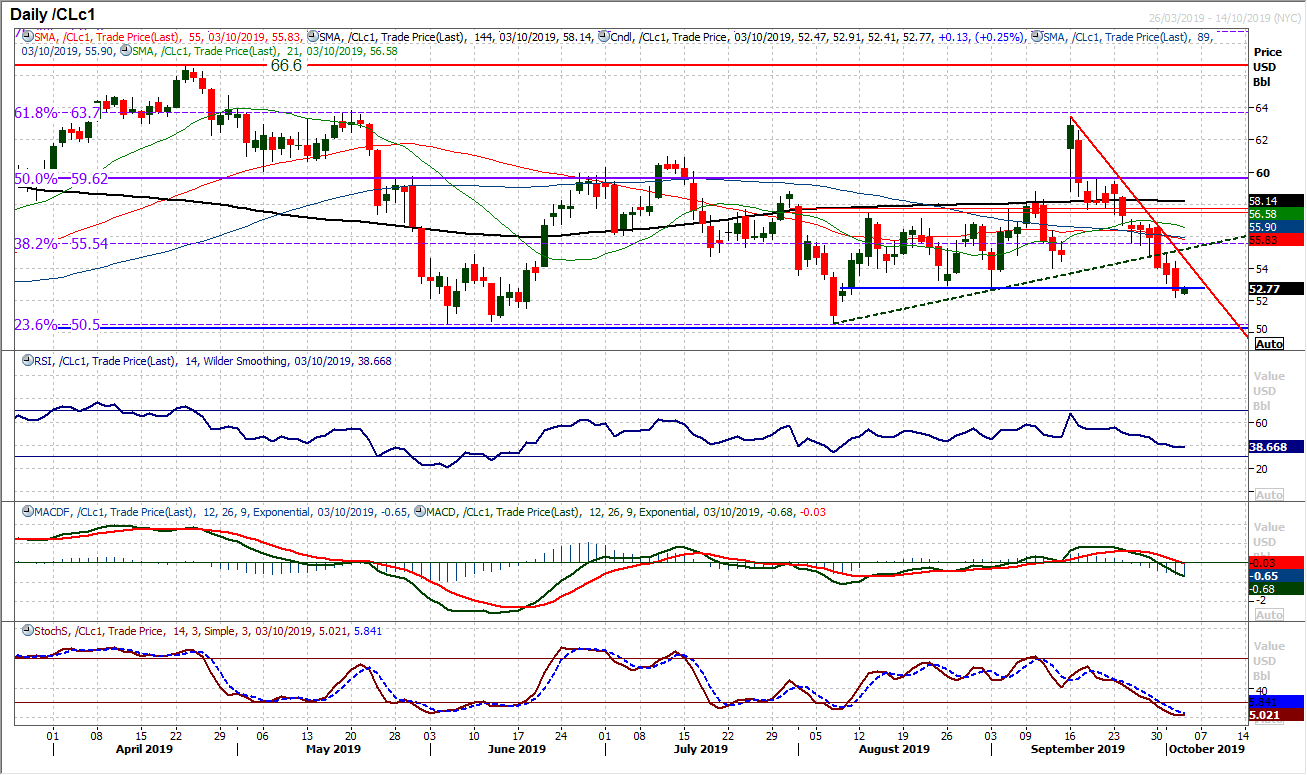
Yet another negative session and bearish candlestick. This is now the 12th of the past 13 sessions. Once again, we saw early gains into the European session not lasting and the rebound being sold into. Momentum continues to deteriorate and support after support is being breached. The latest level to go has been at $52.85 which has now re-opens the crucial summer support at $50.50. With RSI below 40 (a two month low), whilst MACD and Stochastics lines turn corrective and bearish respectively, the outlook is fairly bleak right now. Selling into strength remains key. The hourly chart shows resistance initially at $53.00 but more considerable at $54.00/$54.80.
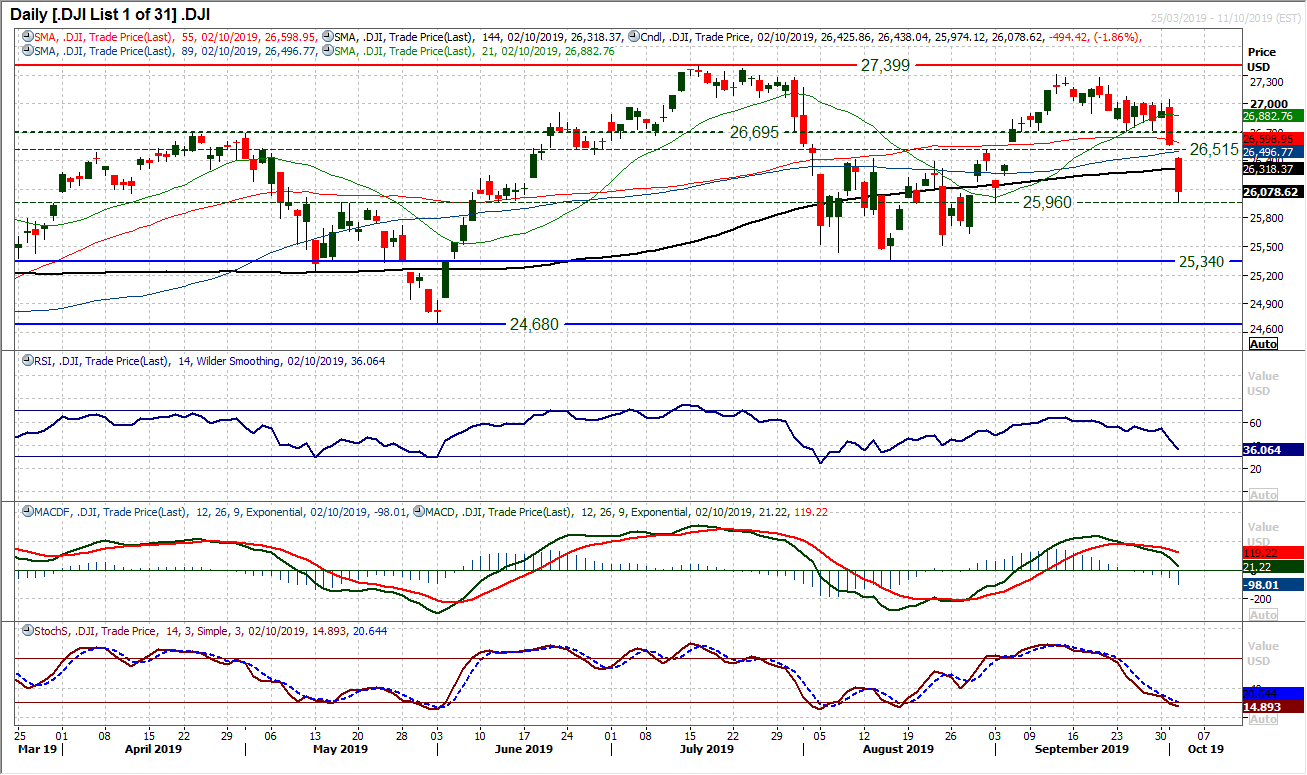
What has been notable about the Dow in recent days, is that once the floodgates have been opened the market has bit hit by a wave of selling pressure. Breaching support at 26,515 has almost instantly seen a retreat back to the next level of support at 25,960 which was a higher low from early September. This is a key level of support because a breach would open a move towards 25,340/25,510 which are the crucial August lows. It is a case of damage limitation now, but momentum is turning sharply negative, with RSI into the mid-30s and pointing to a test of those August lows. MACD lines are accelerating lower, along with the Stochastics too. The hourly chart has though become stretched and how the market responds to what looks to be a degree of stabilisation on US futures early this morning will be key. There is a gap open at 26,560 which is above yesterday’s high of 26,440.
"""DISCLAIMER: This report does not constitute personal investment advice, nor does it take into account the individual financial circumstances or objectives of the clients who receive it. All information and research produced by Hantec Markets is intended to be general in nature; it does not constitute a recommendation or offer for the purchase or sale of any financial instrument, nor should it be construed as such.
All of the views or suggestions within this report are those solely and exclusively of the author, and accurately reflect his personal views about any and all of the subject instruments and are presented to the best of the author’s knowledge. Any person relying on this report to undertake trading does so entirely at his/her own risk and Hantec Markets does not accept any liability. """
