Market Overview
Donald Trump is lauding his “Phase 1” mini trade deal with China, but market reaction seems to have been a little more circumspect. It seems that the US/China negotiations yielded little more than the bare minimum, but at least progress has been made. China agreeing to increase purchases of US agricultural goods, the US agreed to hold off on its increase in tariffs.
The agreement is more of a stepping stone towards the potential for further agreement. Although the US is off for Columbus Day public holiday today how traders react to this deal in the coming days could be crucial. Without anything substantial agreed, will Trump backtrack in the coming weeks? Markets are also on the lookout for signs of further progress on the path towards a Brexit deal. Both sides have been far more positive than at any stage over recent months, but equally both sides admit there is more work that needs to be done.
The most volatile reaction came with sterling last week and will need to be watched for any shift in expectations. However, ahead of another crucial week, it seems that the EU is demanding more detail from the UK over their proposals to surmount the conundrum of the Irish Backstop. An early -70 pip move back lower on Cable suggests the market remains volatile on Brexit newsflow and scepticism could be returning again. With China’s trade data disappointing overnight there is a mild risk negative flow creeping back in this morning.
Wall Street closed with decent gains on Friday with the S&P 500 +1.1% at 2970, whilst US futures are a shade positive +0.1%. Asian markets have been broadly positive, with Japan closed for public holiday, the Shanghai Composite was +1.2%. European markets have a cautious look to them currently, with FTSE futures a shade higher (on negative correlation with sterling) whilst DAX futures are -0.3%. In forex GBP is retracing some of the sharp gains from last week, whilst there is also a safe haven bias with JPY outperforming, whilst the commodity currencies (AUD and NZD) both also weaker. In commodities there is a mixed look to precious metals with gold a touch lower (-$2), whilst oil is also unwinding slightly this morning, -1% back.
There are no key economic releases on the calendar today, although there is a US public holiday for Columbus Day today.
Chart of the Day – AUD/JPY
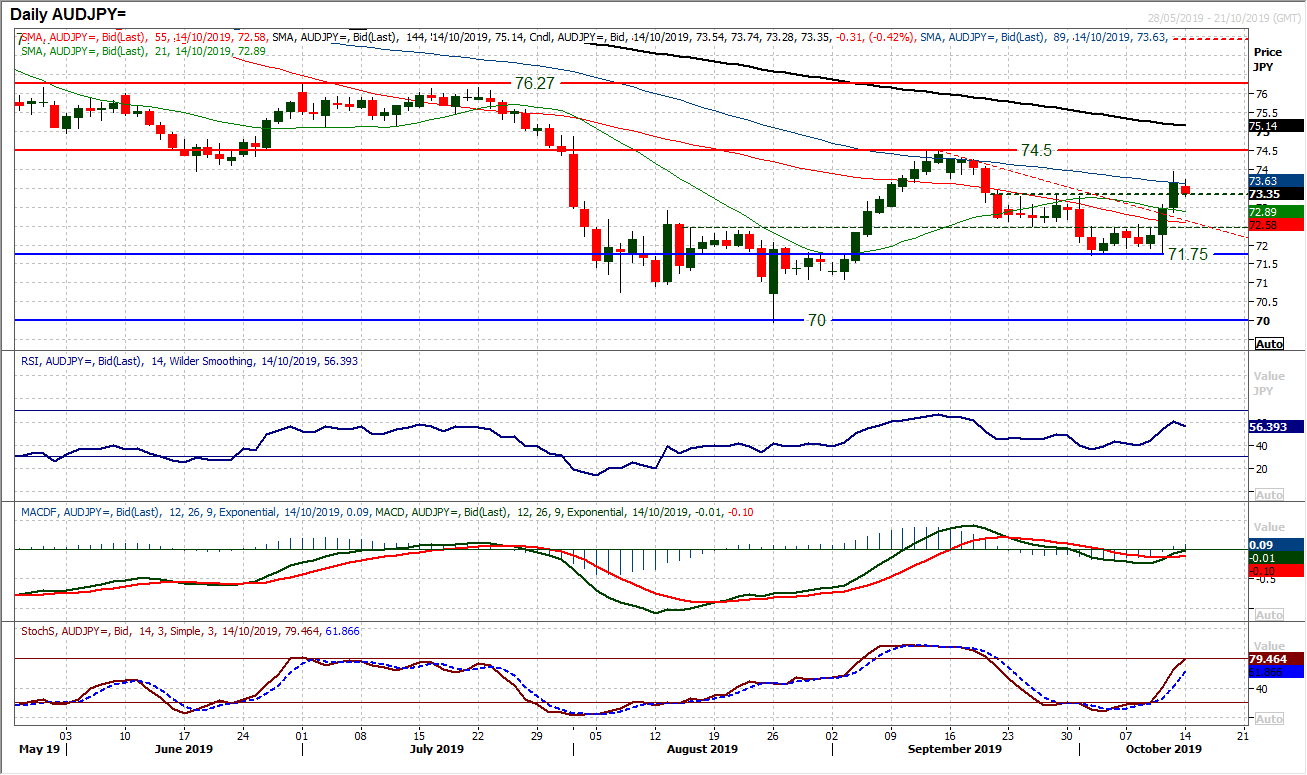
High beta currencies such as the Aussie perform well in a positive risk outlook, whilst the safe have yen struggles. Subsequently we have seen a sharp improvement in recent days on AUD/JPY. The move has formed two hugely strong bull candles and broken through some key technical levels to change the outlook now. A four week downtrend was broken on Thursday, but the move then pushed decisively through resistance at 73.30 which has now opens 74.50. Given that momentum indicators have swung decisively positive now, the outlook is not to buy into intraday weakness. The RSI is accelerating above 60, with Stochastics similarly strong and the MACD lines completing a bull cross just below neutral. The breakout at 73.30 is now supportive, with a near term buy zone on the hourly chart between 73.05/73.30 to look for opportunities during today’s intraday weakness. Initial resistance is at 74.10/74.30 but a test of 74.50 is now growing.
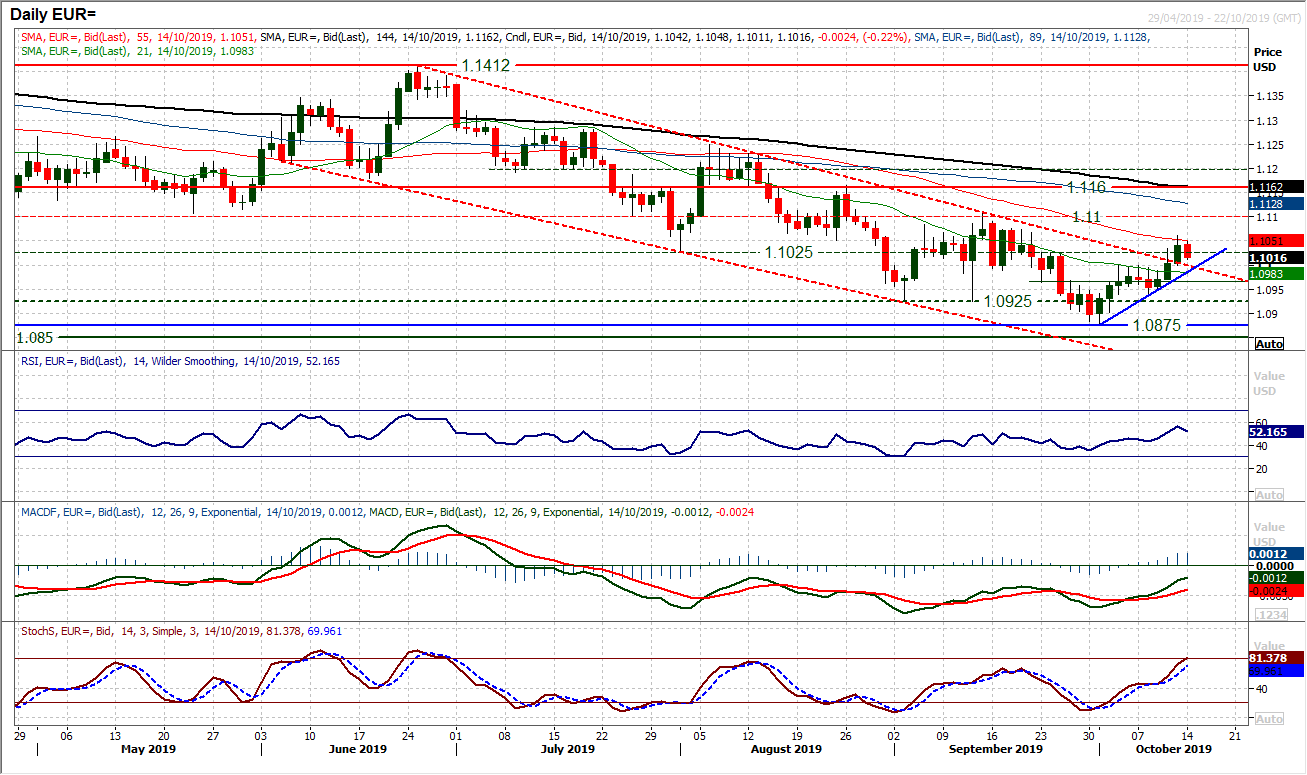
There has been a significant shift in outlook for EUR/USD in the past few sessions. Three bull candles have seen the market breaking out of a three and a half month downtrend channel and the bulls are looking increasingly positive now. The move above $1.1000/$1.1025 is also a key move which primarily opens $1.1100 but is a signal that no longer are old supports restrictive to recoveries. A new mini uptrend is now developing, with $1.0940 as the first important higher reaction low. The encouraging positioning of the momentum indicators adds to the conviction that the long held selling pressure has dissipated. The RSI above 53 reached its highest since July on Friday, whilst Stochastics are similarly positioned and MACD lines accelerating higher. The hourly chart shows the importance of $1.1000/$1.1025 as support now, whilst the growing two week uptrend comes in at $1.0985 today. Initial resistance is Friday’s high of $1.1060 whilst the next key test is $1.1100.
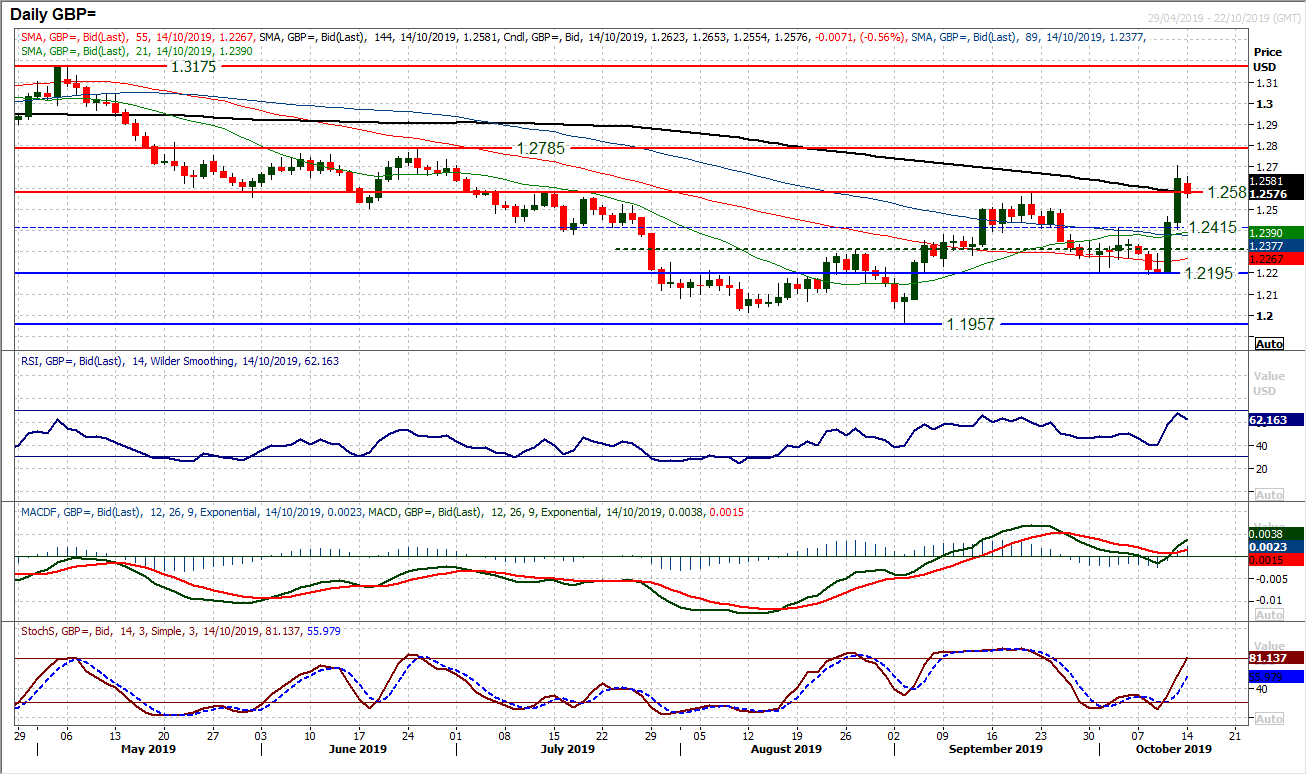
A two day low to high range of over 500 pips shows how the market has massively shifted expectation of the politics on a potential Brexit deal. But is it sustainable? The technicals would certainly suggest that this is a move to be backed, with a MACD bull cross and decisive positive momentum on Stochastics. The early slip back today needs to be watched though as a failure under $1.2580 breakout could be indicative of souring expectations once more. The problem is that where there are politicians involved in Brexit the power to disappoint will be great. Any failure to secure a deal (especially in acrimony) will see the market back at $1.2200 in the blink of an eye. This is all about the politics right now. Above $1.2705 opens $1.2785.
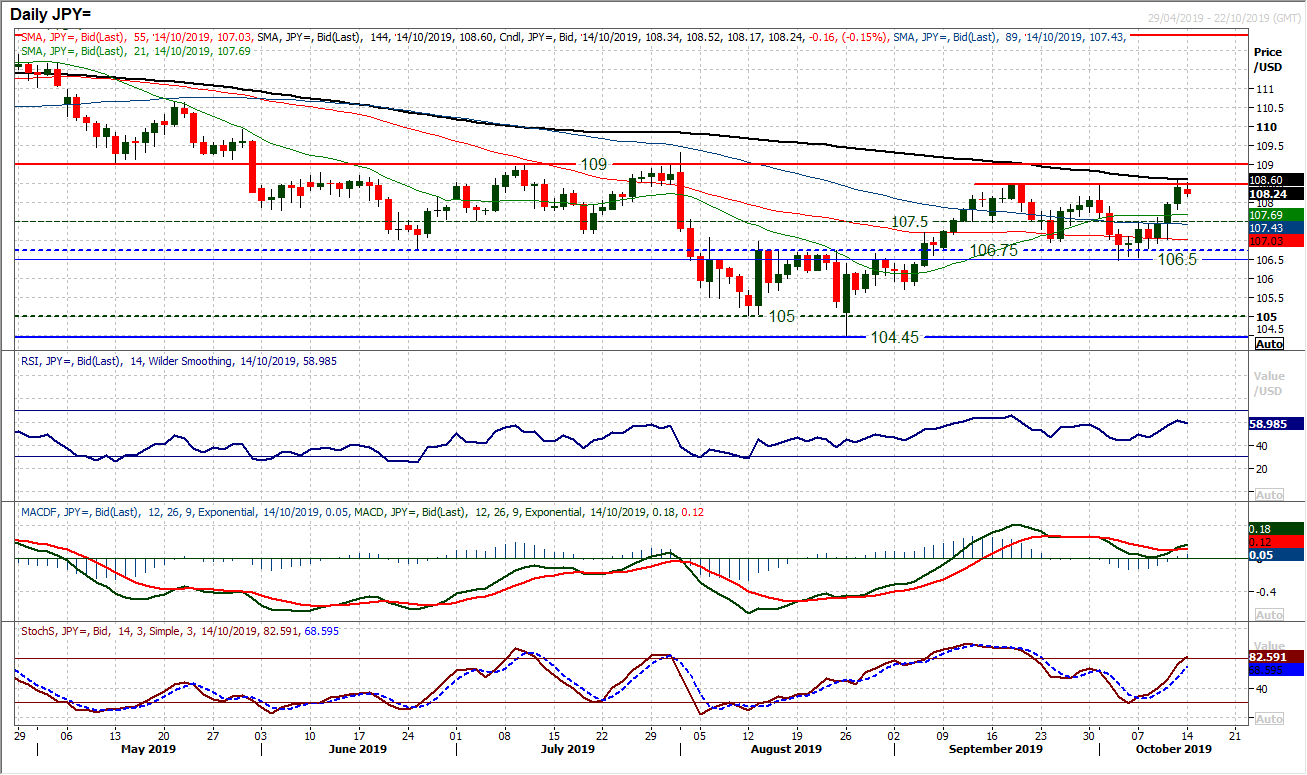
The yen is being sold off as a significant major underperformer, which is driving Dollar/Yen higher. A test of the September highs of 108.50 is underway. A closing breakout would now open the next major resistance pivot at 109.00. Momentum indicators are increasingly positive now and suggest that near term rallies are a chance to buy. The RSI is around 60, whilst MACD lines have bull crossed above neutral and Stochastics are accelerating higher. An early slip back today has again retreated from a test of the 108.50 resistance, but as yet this seems to be a pause for breath. The hourly chart reflects this momentum strength with corrections being bought into. However, the bulls would not want to see the hourly RSI under 35 or the hourly MACD decisively under neutral. A near term support band 108.10/108.50 is a decent “buy zone” now to look for opportunities.
Gold
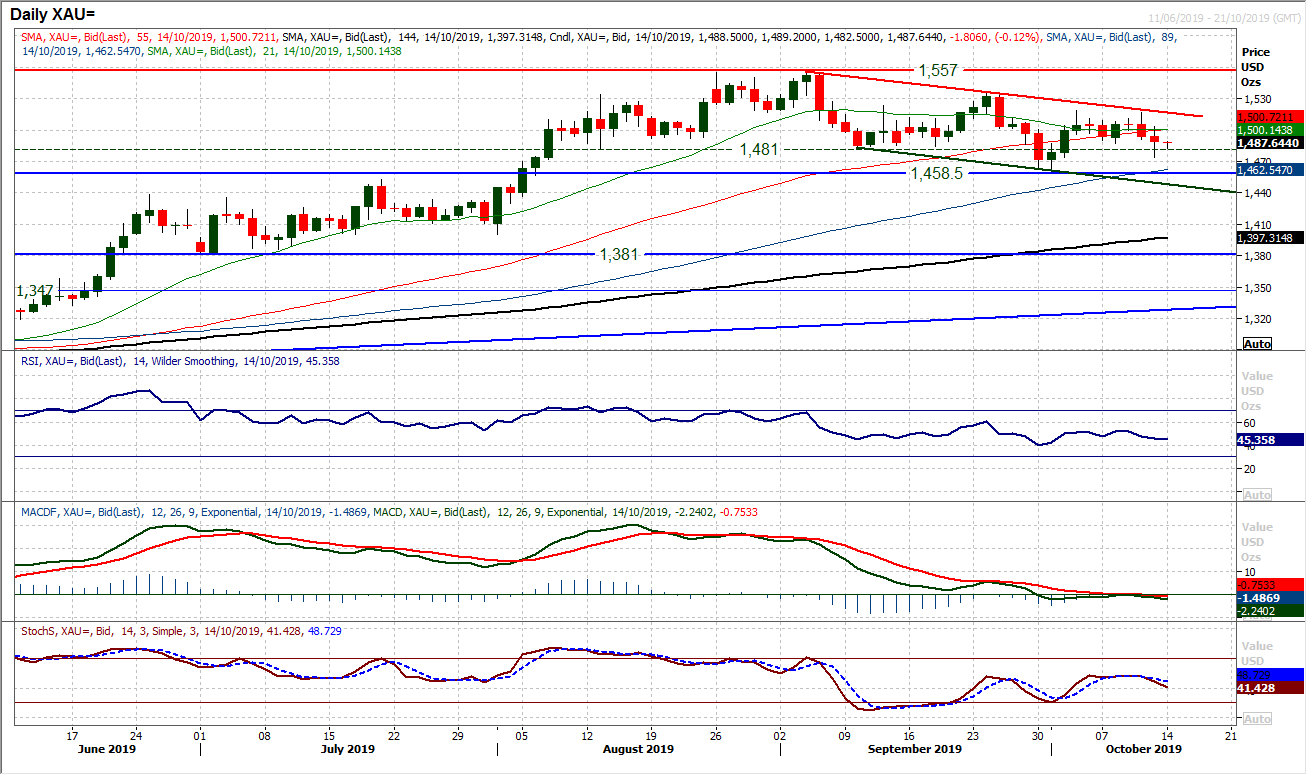
Gold is under mounting pressure as risk appetite has improved markedly in the past couple of sessions. Two negative candles mean the outlook is deteriorating within what is still a multi-month range $1458/$1557 now. However, the bulls fought back into the close on Friday and there is a sense that they are not willing just to roll over quite yet. A breach and close below $1481 (the old key low) would ramp up the pressure, but for now there is still some uncertainty that would suggest continuing to play this as a range. There is an undoubted negative bias right now, but the outlook is by far from certain. An RSI move below 40 would be a significant deterioration, whilst MACD lines would need to find traction off a bear cross (not yet confirmed). There is though resistance overhead at $1490/$1503 now which is building, with the selling pressure gradually mounting.
WTI Oil
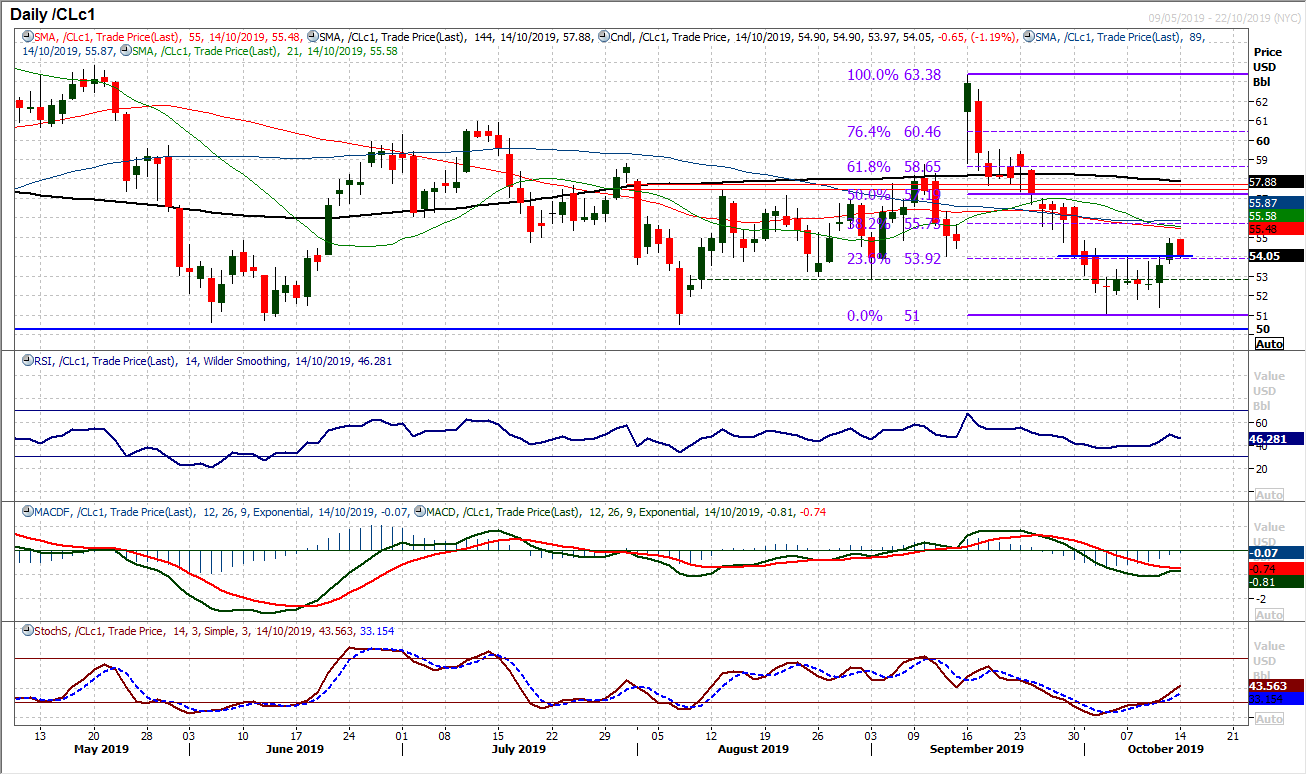
A couple of decisive positive candles and there is a significantly different outlook for WTI. Suddenly the bulls look to have more confidence and the potential for recovery is growing. A breakout above $54 was a key move on Friday and completed a small base pattern which implies $2.60 of additional recovery, meaning $56.60 should not be ruled out now. This comes with a bull cross finding traction on Stochastics, whilst MACD lines are also close to a breakout. However, the reaction to the early drop back this morning will be important now. Previously, during late September it was a consistent feature that intraday rallies were consistently sold into. Will intraday weakness now be seen as a chance to sell? There is support at $54.00 and $53.90 (the 23.6% Fib level). A move back to close the old (now filled) gap at $53.55 would be a bull disappointment now.
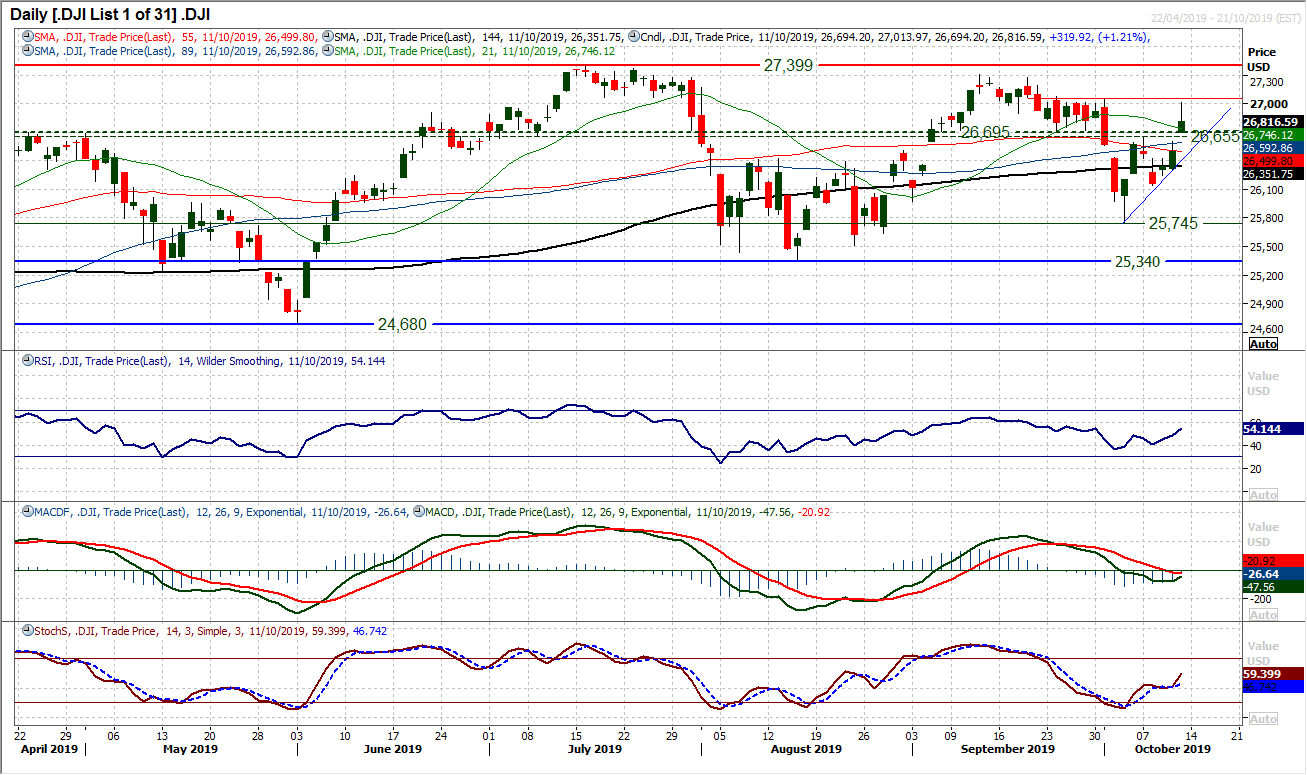
The Dow broke above a key area of resistance on Friday to significantly improve the outlook once more. The resistance band 26,655/26,695 was a pivot based around an old support of overhead supply from September. However, a decisive move clear has put the bulls in the driving seat once more. A test of the next band of resistance 27,045/27,080 is now open. This comes with momentum indicators all looking to improve too, with the Stochastics pulling higher, RSI rising above 50 and MACD lines setting up for a possible bull cross at neutral. Holding the pivot at 26,655/26,695 as a band of support now will be important for the bulls. There is a gap open around 26,600 (which ideally needs to be filled), whilst a mini uptrend at 26,535 is supportive too. Whilst holding these supports, the Dow is a buy into weakness now.
"""DISCLAIMER: This report does not constitute personal investment advice, nor does it take into account the individual financial circumstances or objectives of the clients who receive it. All information and research produced by Hantec Markets is intended to be general in nature; it does not constitute a recommendation or offer for the purchase or sale of any financial instrument, nor should it be construed as such.
All of the views or suggestions within this report are those solely and exclusively of the author, and accurately reflect his personal views about any and all of the subject instruments and are presented to the best of the author’s knowledge. Any person relying on this report to undertake trading does so entirely at his/her own risk and Hantec Markets does not accept any liability. """
