Stocks jump, yields dump that’s the story of last week as overstretched positioning ran into some dovishness from central banks, decent enough earnings, and some softer data. Markets have seen a pivot – they’re probably overdoing it – but the idea that CBs are at the peak is driving risk appetite and pushing down yields. The Fed left rates on hold and sounded like it thinks it might be at the top. The Bank of Japan was disappointed with a puny tweak to yield curve control, and the Bank of England paused: Bailey-like stout Cortez, with eagle eyes, stared at the horizon, silent upon the top of Table Mountain.
Global central banks have hit the pause button – or have they? The Reserve Bank of Australia is in action this week and could restart the hiking cycle: this might be important, it might not. But the RBA has tended to lead where other central banks have followed. So, it will be interesting to see what the central bank opts to do this week, even if we cannot at this stage extrapolate it across to the Fed et al. Inflation rose more than expected in the last quarter -with the trimmed mean at 5.2% from 5.0% - and the expectation has generally been that the RBA would hike at least once more. In October the RBA hinted as much:
"The Board has a low tolerance for a slower return of inflation to target than currently expected. Whether or not a further increase in interest rates is required would, therefore, depend on the incoming data and how these alter the economic outlook and the evolving assessment of risks."
The question is this – if it hikes by 25bps to 4.35%, does it signal that is the end? I don’t believe it will and this could see bond yields move up.
Jobs data was confirmation bias for many that the Fed is done. Nonfarm payrolls increased by 150,000 in October, whilst the previous month was revised down quite a bit. The NFP broke the back of the bond bears – hedge funds went even more short in the run-up. The US 10-year yield has retreated over 40bps in the last couple of weeks, with the sharp move lower last Friday following the jobs report seeing it back under 4.6%. But the front end has also shipped as markets dial back expectations for another Fed hike and bring forward when they think it will cut.
European stock markets are flat to start the week after a broadly positive session in Asia overnight. South Korean stocks rallied as the authorities said they would reimpose a ban on short-selling until June 2024, sending the Kospi up 5%. Oil trades higher this morning after Saudi Arabia and Russia confirmed they would stick to supply reductions until the end of the year – crude had slumped last week with Brent covering the Oct 7th gap and WTI slipping to its lowest since August.
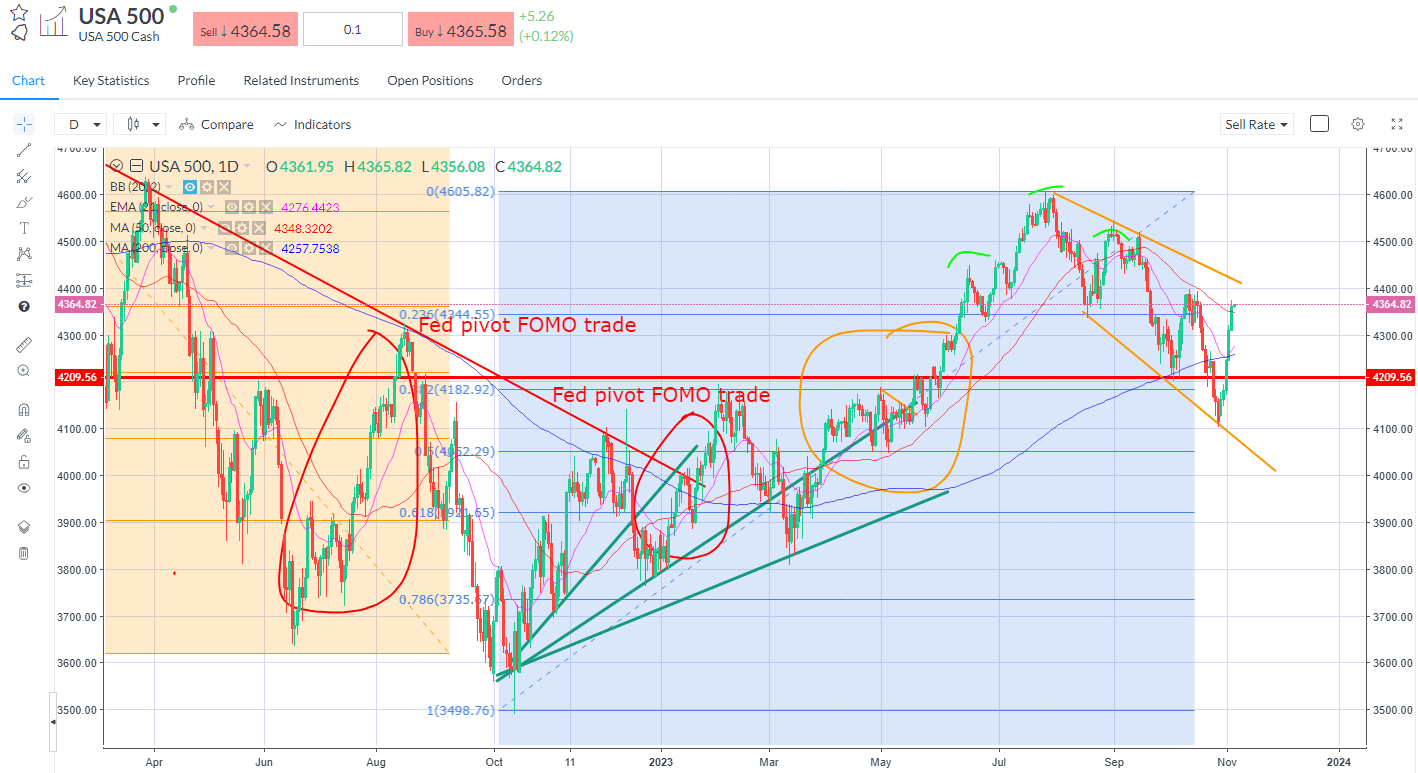
US indices registered their best week of the year. The Dow ended the week up by 5%, its best since October 2022; the S&P rose 5.85% and the Nasdaq rallied 6.6% for their best week since November of that year.
SPX – running into the October swing highs – three down months but seasonally November is good and the pick-up last week is lighting up the eyes of the bulls. Does the Fed cut early next year? BofA: “So much anger, so much hate, yet unemployment so low; can you imagine the social disorder if unemployment hits 5%; that’s why policy panic comes early in ‘24.” I’m less sure, that unwinding the higher for longer message will take time. Still, front-running the first cut is the name of the game. And if CBs are accepting inflation will be higher – the symmetric approach implies a readiness to cut. 
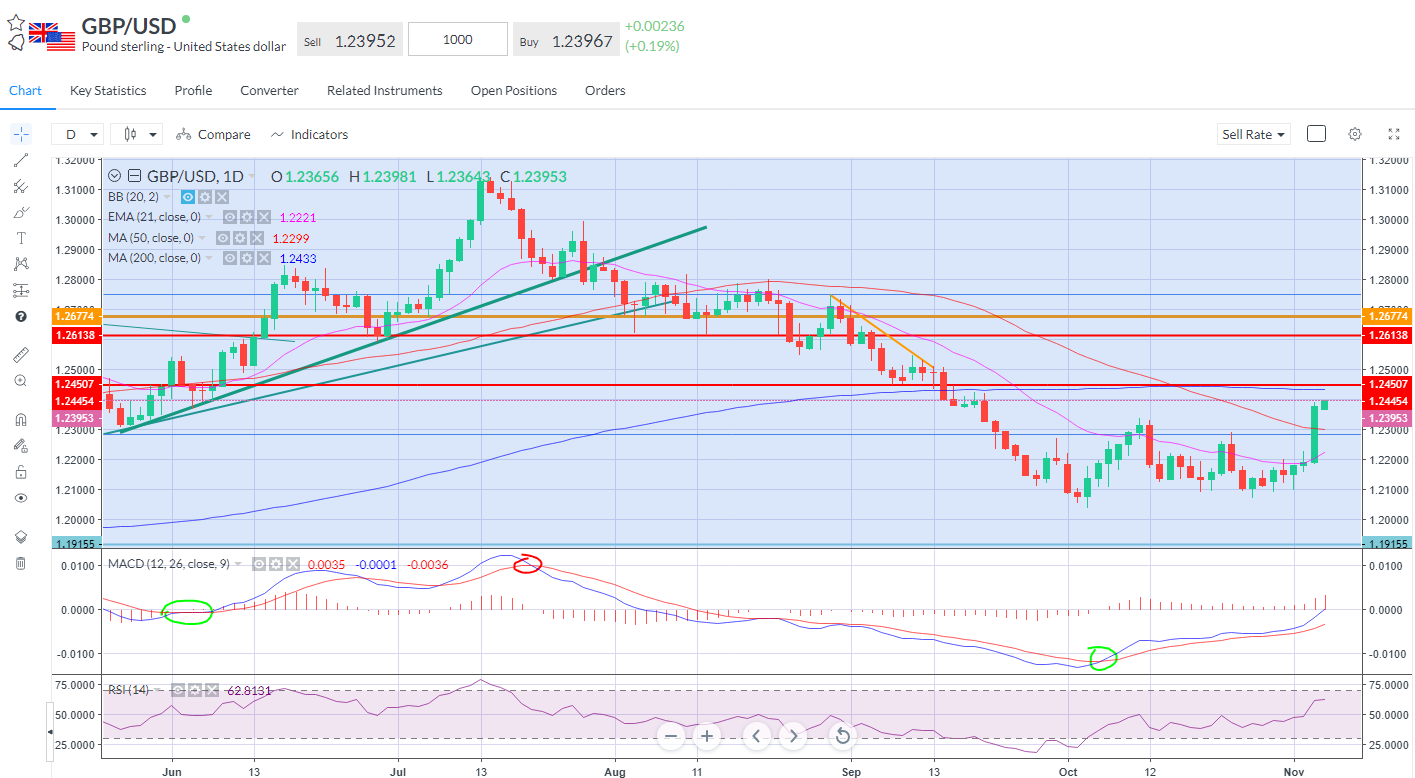
The sharp reversal in fixed income markets spread to forex and equities pretty sharpish. The dollar slid to its weakest in almost two months and trades weaker this morning again. Sterling rallied to a 6-week high at almost $1.24 where it seems to be facing some near-term resistance, but it’s cleared the 50-day line in a manner such as it did a the start of June, which preceded roughly 5% rally to $1.30.
GBP/USD – clearing the bottom, bullish MACD still in charge after Friday saw the best one-day rally since January. 
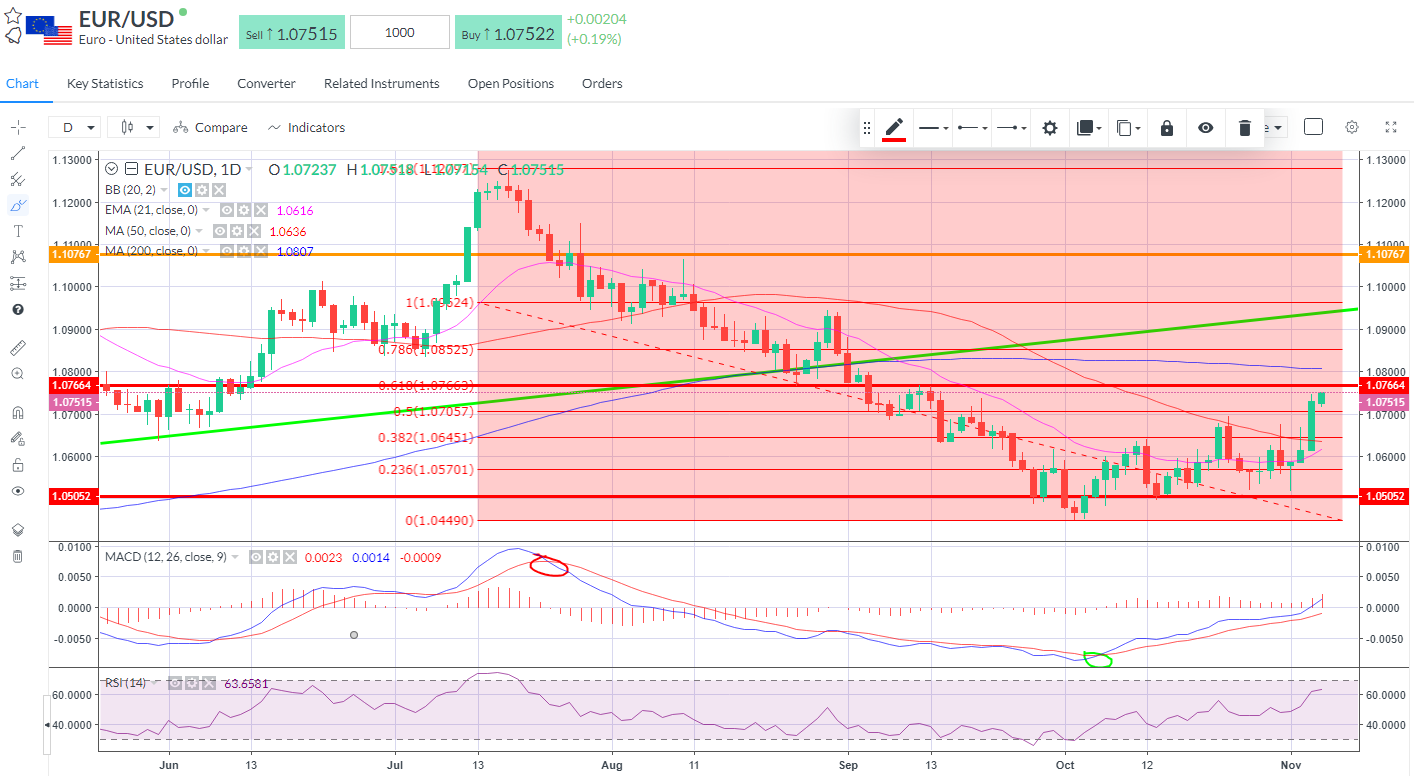
EUR/USD – mirroring the move with a similar MACD profile
Meanwhile, the ECB’s Executive Board member Isabel Schnabel warned about the difficulties facing central banks in getting inflation to 2%, alluding to the fact that they will need to accept structurally higher inflation. She said
“Bringing inflation from here back to 2% in a timely manner may be more difficult. Headline inflation in the euro area declined rapidly to 2.9% in October from its peak of 10.6% one year earlier. Oil and gas prices, in particular, have come down remarkably fast from the highs underlying price pressures can prove much stickier than volatile commodity prices the disinflation process is projected to slow significantly there is large uncertainty about how structural changes will affect activity in the euro area and globally, making the calibration of monetary policy more difficult”.
