Over the weekend, New Zealand announced plans to increase infrastructure spending in order to boost growth into 2020. When the markets opened on Monday morning, NZD/USD was shot out of a cannon. Add to that a better than expected NBS China Manufacturing PMI and a better non-official Caixin Manufacturing PMI, and NZD/USD took off.
Today is Thursday, and the Kiwi pair hasn’t looked back since! Just today, RBNZ Governor Orr suggested rates are on hold at the next RBNZ meeting in February given the strong data and expected fiscal stimulus over the next year. But is it time for NZD/USD to pause and take a breather?
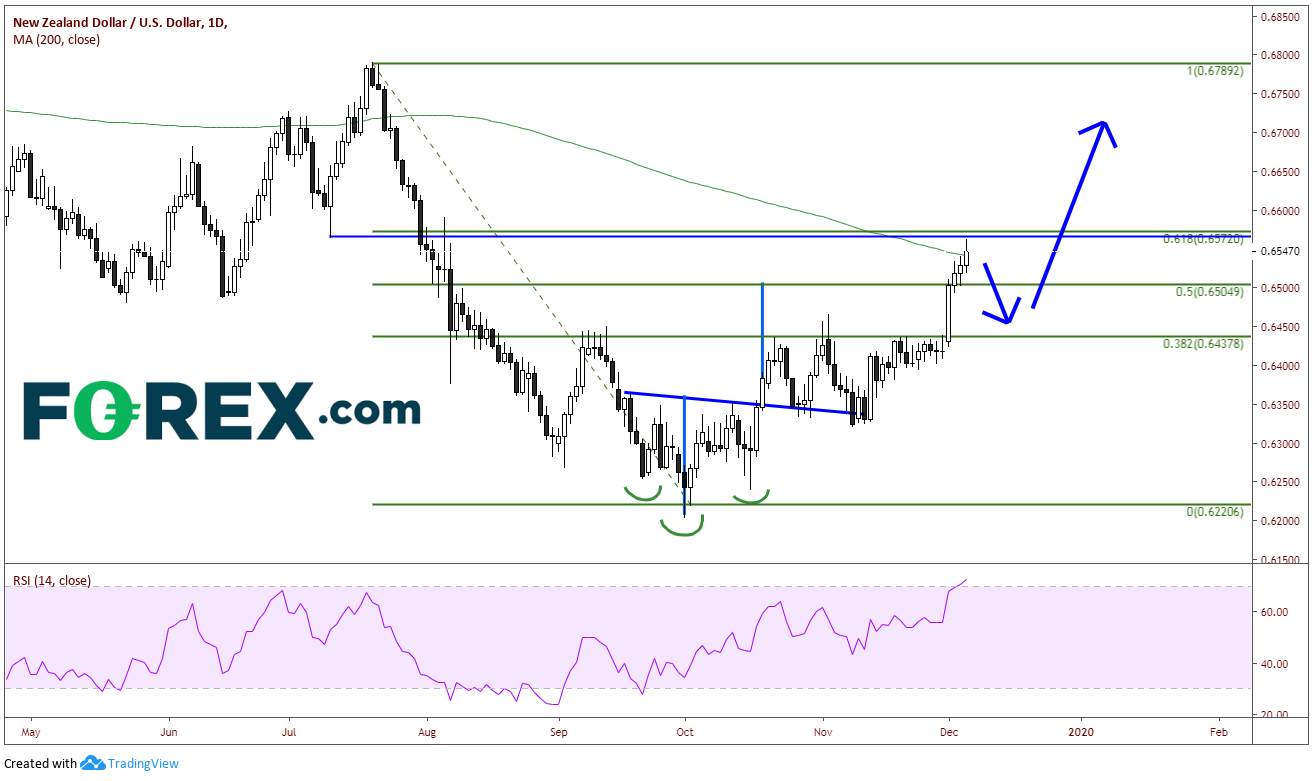
NZD/USD is up over 2% on the week and its highest level since early August. On a daily chart, the pair broke the neckline of its inverse head and shoulders pattern on October 18th, retested it twice, and finally hits the target level on Monday near .6500. This level also coincides with the 50% retracement level from the July 19th high to the October 1st low.
NZD/USD pushed right to the Fibonacci retracement 61.8% retracement level of that same timeframe and halted near .6572. This level also coincides with horizontal resistance dating back to July. The pair has pulled back slightly from there on the day and closed at the 200 Day Moving Average near .6545. The RSI on the daily is also at overbought levels. But is this enough for NZD/USD to pull back?

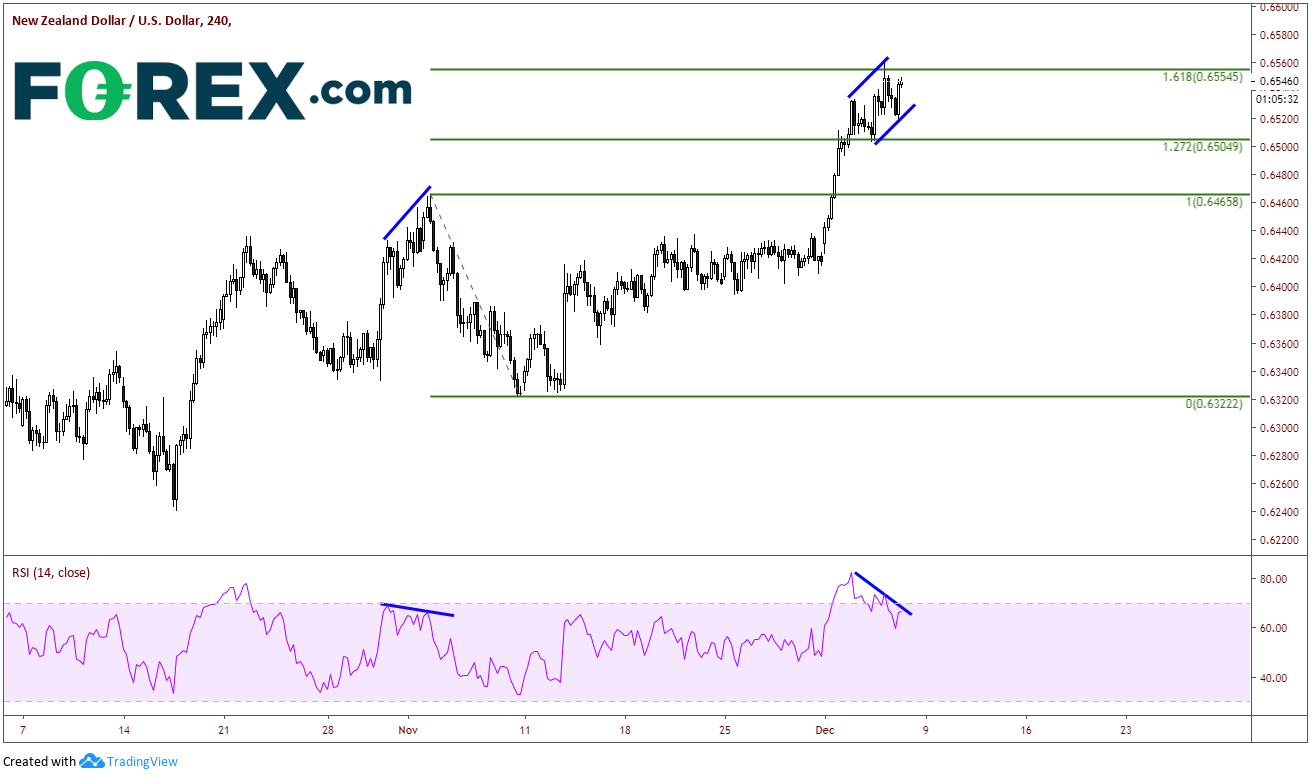
On a shorter 240-minute timeframe, NZD/USD traded up to the 161.8% Golden Fibonacci level from the high on November 4th to the lows of November 8th at .6555. The RSI is also diverging with price from overbought levels. Support comes in at .6500 and then .6458.

All of this indicates the NZD/USD may be ready for a pullback, possibly on some profit taking, heading into the weekend. Although lately there always to be some kind of positive Friday tweet from US President Trump’s team regarding the US-China trade deal, one must consider if the markets are now immune to these headlines. If the markets no longer care, NZD/USD may be ready to pare its weekly gains.
