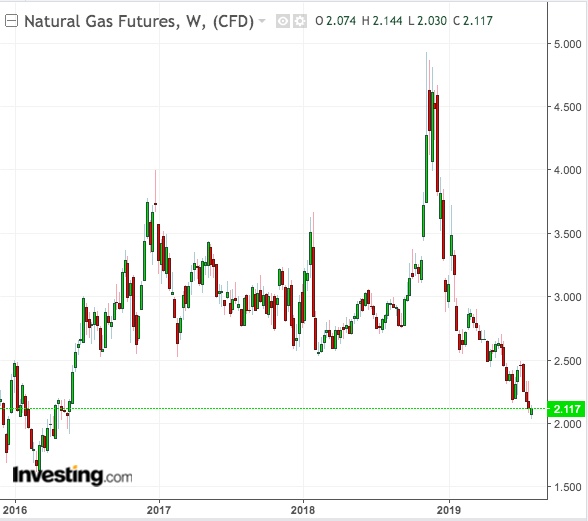
U.S. natural gas could be on the cusp of breaking below the $2 pricing it has defended since 2016, as production of the fuel continues to overwhelm despite a pipeline outage.
For the second week in a row, gas in storage is expected to have grown above normal, even after a spike in summer heat that should have resulted in the burning of more gas to feed higher electricity demand for air-conditioning.
The U.S. Energy Information Administration (EIA) is likely to report in its weekly dataset for natural gas, due at 10:30 AM (14:30 GMT) today, that utilities across the United States injected 59 billion cubic feet (bcf) into storage for the week ended Aug. 2. That would be nearly 30% more than the same week a year ago, despite recent outages caused by a pipeline explosion in Kentucky. Higher temperatures last week also mean there would have been more gas consumption than usual.
The same week—to Aug. 2—last year, injections into storage amounted to just 46 bcf. Over a five-year (2014-2018) period, storage growth for the week was even lower, at 43 bcf.
If the EIA indeed reports a 59 bcf storage build for last week, it would be the second straight week of such anomaly. In the previous week to July 26, injections amounted to 65 bcf, versus 31 bcf a year earlier and a five-year average of 37 bcf.
In terms of gas pricing, what these mean, of course, is more pressure for the market.
On Wednesday, September gas on New York Mercantile Exchange’s Henry Hub came precariously close to breaking below the $2 per million metric British thermal units level. The session low was $2.03 per mmBtu, although settlement on the day itself was $2.083.
$2 Support Could Snap If Latest Injection Goes Way Above 60 bcf

While a 9-cent, near 5% drop is still a little steep in a day’s trading of gas, it could easily happen if the EIA reports injections totaling sharply above 60 bcf for last week. Should September gas slip into the $1 pricing zone, albeit even briefly, it would be the first time that has happened to a front-month Henry Hub gas contract since May 2016.
Dan Myers, analyst at Gelber & Associates in Houston, said Henry Hub futures have been unable to stage a convincing recovery since a recent tumble to three-year lows.
But he noted that the market has also been hesitant to completely give up on bullish sentiment and plunge below $2.
Said Myers:
“The market has found some support from the warmer-than-normal weather in early August, and a new swath of coal-to-gas fuel switching that has propped up recent power generation estimates.”
Still, he said, record production and reduced demand for liquefied natural gas were weighing on prices, leaving "little room for bullish sentiment."
Gas production in the Lower 48 U.S. states averaged a near record 90.6 bcf per day last week even though an explosion on Enbridge Inc's Texas Eastern pipe in Kentucky caused some gas drillers in the Marcellus and Utica shale patches to shut in wells, according to traders and data from Refinitiv, an unit of Thomson Reuters.
Weather Supportive But Not Enough To Drain Stockpiles
The weather, meanwhile, was warmer than normal last week, with 97 cooling degree days (CDDs) versus a 30-year average of 88 CDDs for the period and 91 CDDs for the same week last year. CDDs measure the number of degrees a day's average temperature is above 65 Fahrenheit (18 Celsius), and are used to estimate demand to cool homes and businesses.
Dominick Chirichella, director of risk and trading at the Energy Management Institute in New York, said latest weather forecasts showed a portion of below-normal temperatures over the U.S. Midwest, improving to normal. He added:
“If this trend continues to evolve, we could get another increased spurt of a higher level call on Nat Gas for cooling related demand.”
Even so, Chirichella said, the year-over-year inventory situation will remain in a surplus, “with the deficit versus the five-year narrowing."
If analysts’ estimates are on target, last week’s storage boost would have kicked up stockpiles to 2.693 trillion cubic feet—nearly 15% above the same week a year ago but less than 4% below the five-year average.
Myers of Gelber & Associates said:
“With current forecasts, storage is expected to continue climbing at a faster-than-average pace and would exit August only 46 bcf under 5-year average levels.”
