- The S&P 500 defied May's historical trends with a robust 4.8% gain.
- But market breadth concerns loom as fewer stocks participate in the rally, indicating potential bearish signals.
- Investors are now eyeing a possible Fed rate cut in September, hoping it might sustain the current bull market.
- Invest like the big funds for under $9/month with our AI-powered ProPicks stock selection tool. Learn more here>>
May defied its historical reputation, ending with a strong 4.8% gain for the S&P 500 – the best performance in 15 years.
But what about June?
Historically, June has been a bit more predictable for the S&P 500, averaging a modest 0.1% return since 1950.
Even better, 55% of the time, June delivers a more robust 0.7% average monthly gain. Additionally, in election years, the index has typically risen by an average of 1.3%. 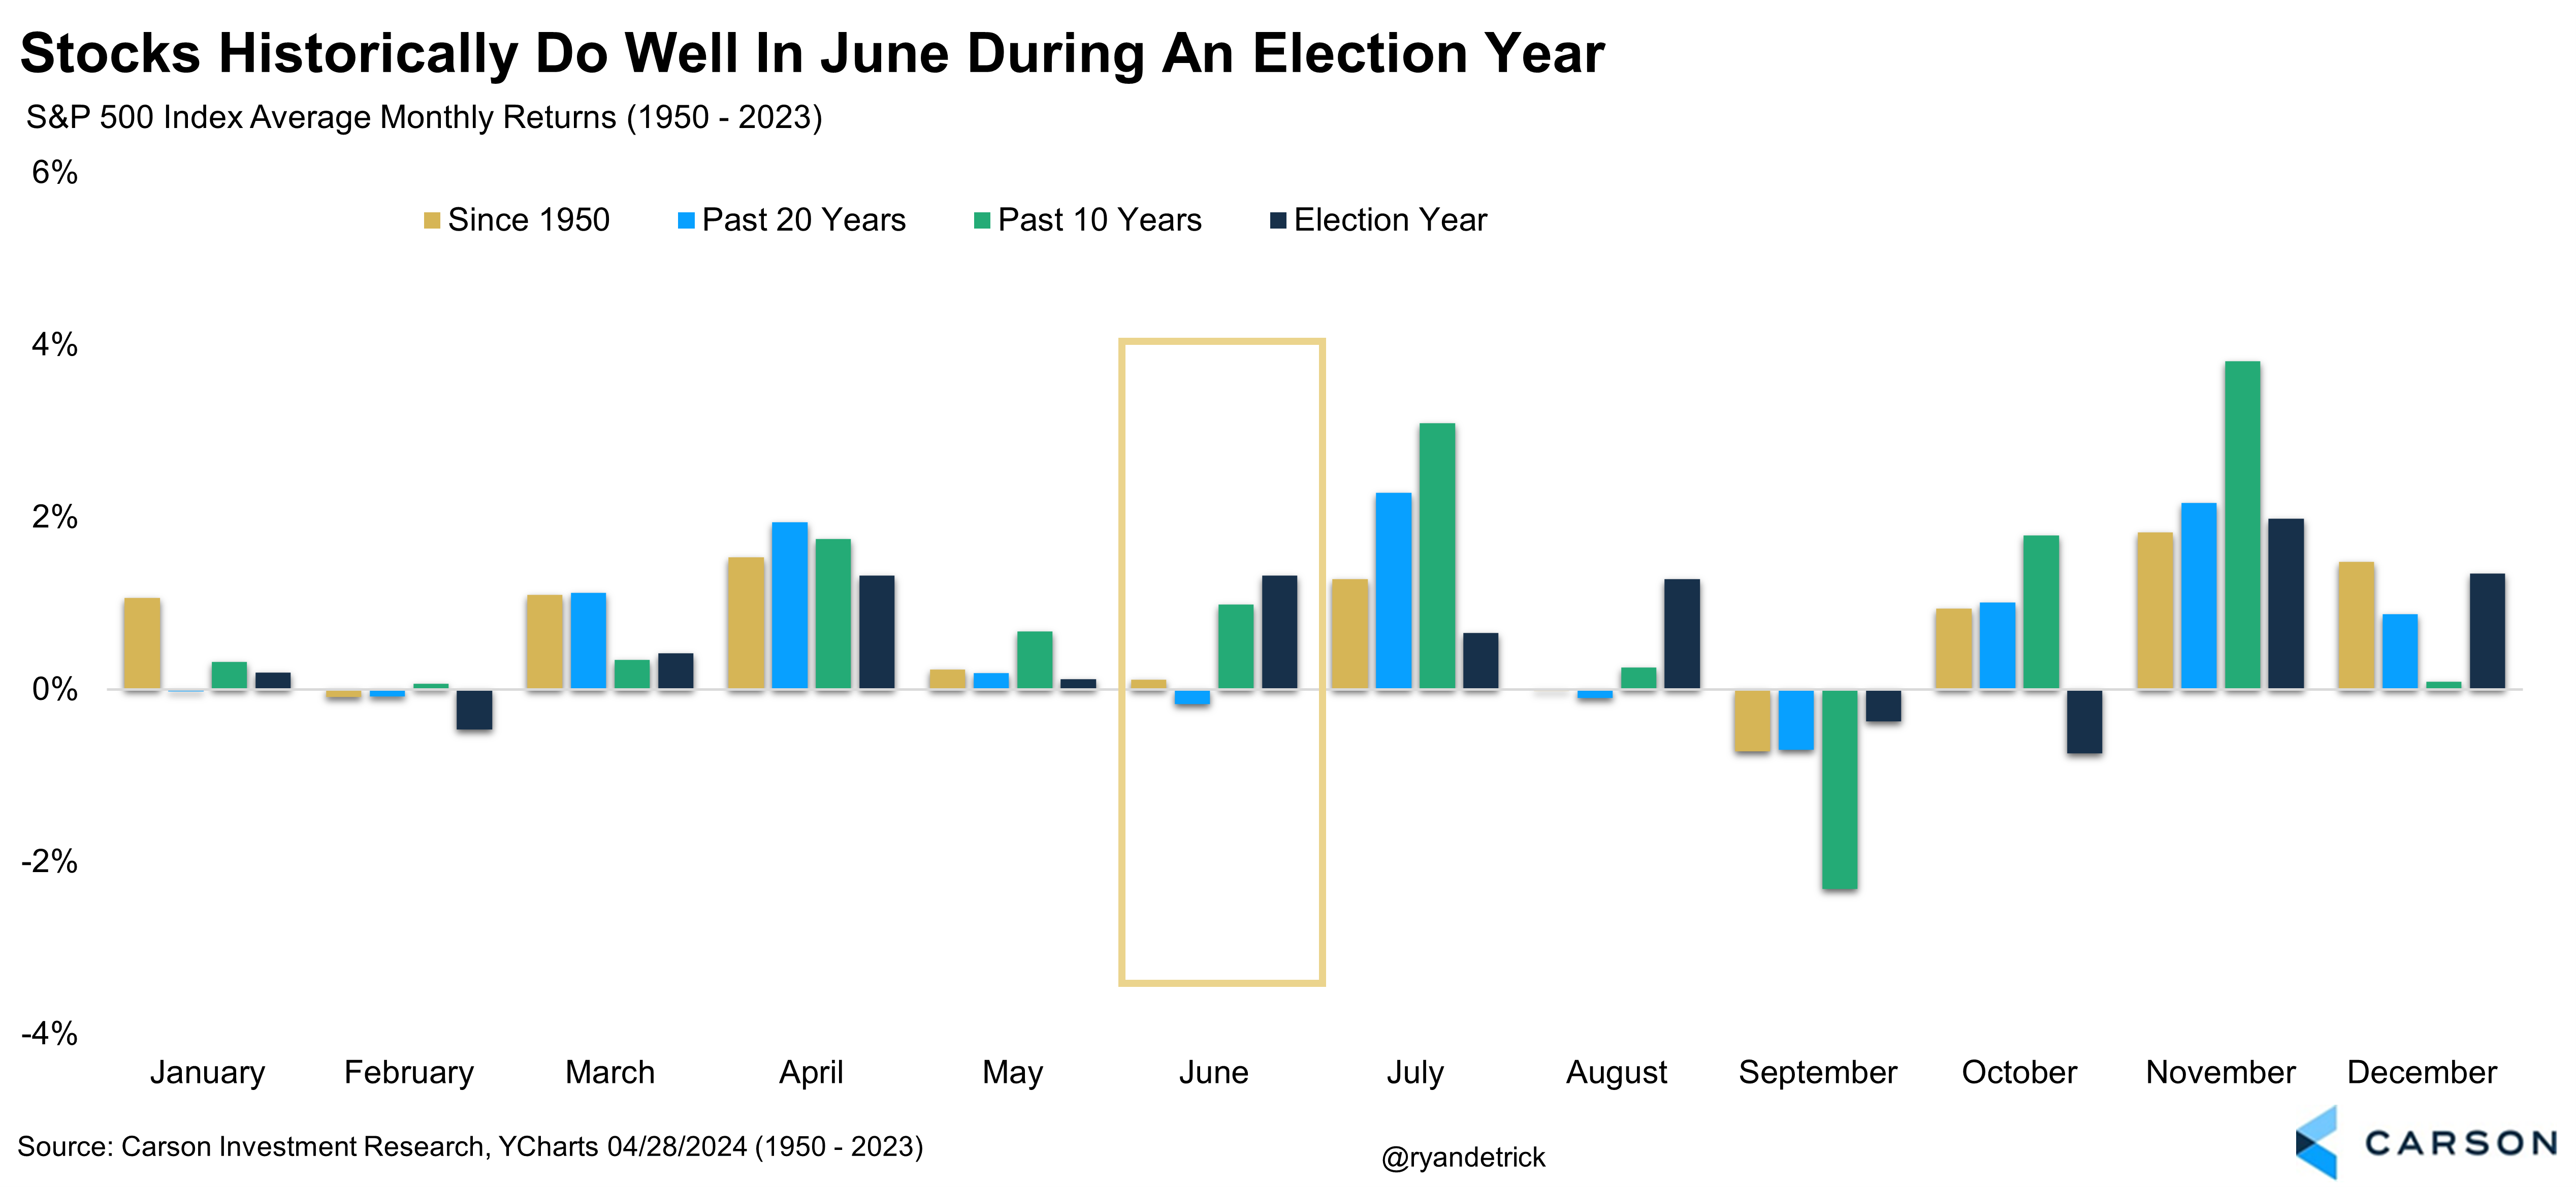
Narrowing Market Breadth Remains a Concern
However, a recent wrinkle emerged despite the S&P 500 reaching new highs for both the year (24th record high) and since March. Market breadth, a measure of how many stocks are participating in the rally, seems to be weakening.
While the index itself is climbing, the gains appear concentrated in a few large-cap stocks.
A worrying trend emerged last week. Around 20% of large-cap stocks hit 3-month lows, a scenario not seen since October 2023.
Additionally, the percentage of stocks trading above their 50-day moving average is declining, suggesting a potential bearish shift.
This is further reinforced by fewer stocks reaching new 52-week highs and trading above their 200-day moving average compared to March. 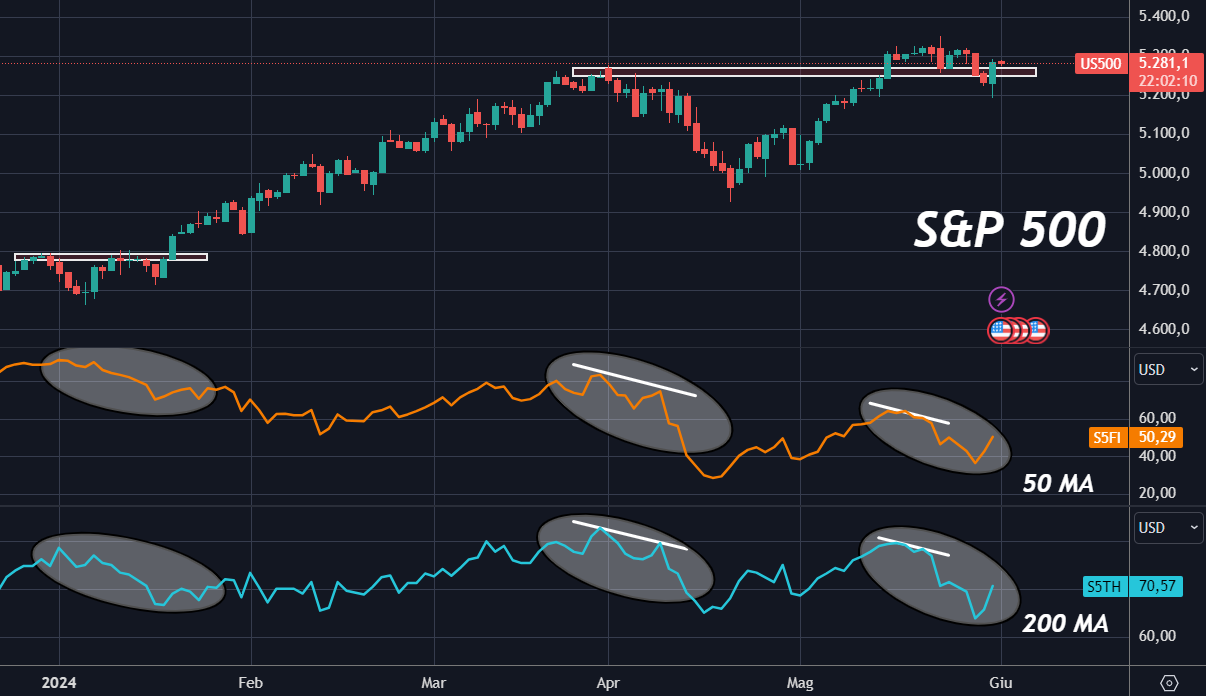
The chart reveals a troubling similarity to April's decline. While the index itself broke above its previous high in May, participation in the rally was narrow.
This stands in stark contrast to the broad market participation evident earlier in the year when more stocks were trading above their 50-day and 200-day moving averages. This divergence between the index and individual stocks creates a bearish signal.
Deep Correction in the Cards in June?
While pullbacks and volatility are normal for the stock market, 2024 has been remarkably quiet. The year's biggest decline has only been 5.5%, making it one of the least volatile periods in recent history.
This lack of volatility is surprising, especially considering ongoing concerns about interest rates, inflation, and geopolitical risks. Even with these factors in play, market reactions to data releases and news have been muted. 
Historically, the average annual decline in the market is 14.2%, and even excluding bear markets, it's still 10.1%. This tells us that even strong markets experience temporary dips.
Therefore, the 5% decline we've seen so far in 2024 might not be the last. Uncertainties are likely to resurface and cause further market fluctuations, though hopefully not prolonged or severe.
Market Pins Hopes on a Rate Cut
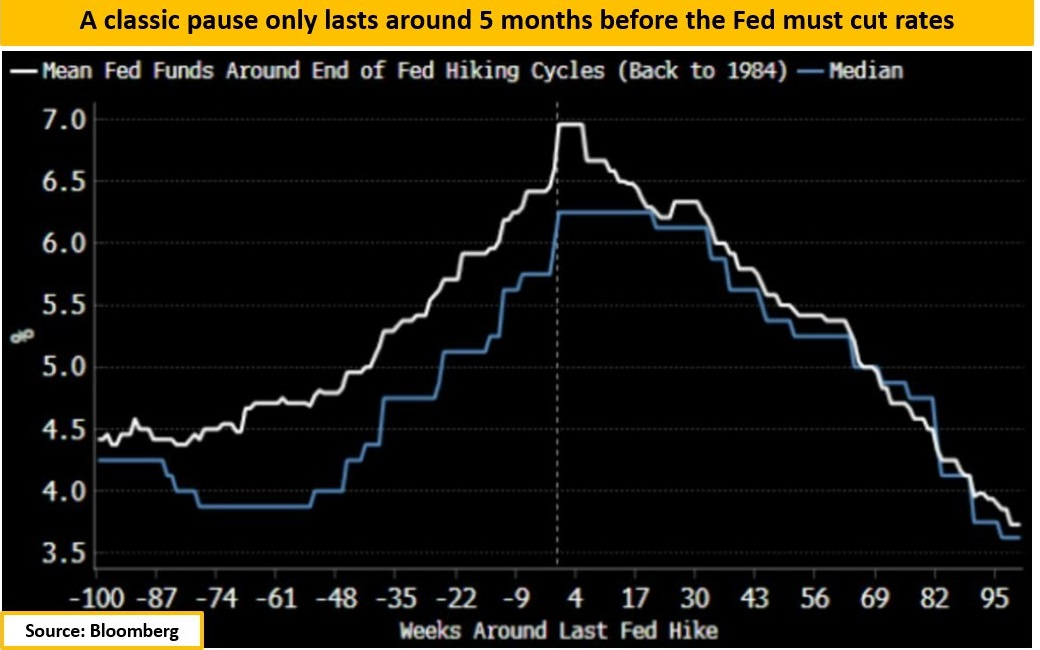
Many anticipate the first rate cut from the Fed to happen in September.
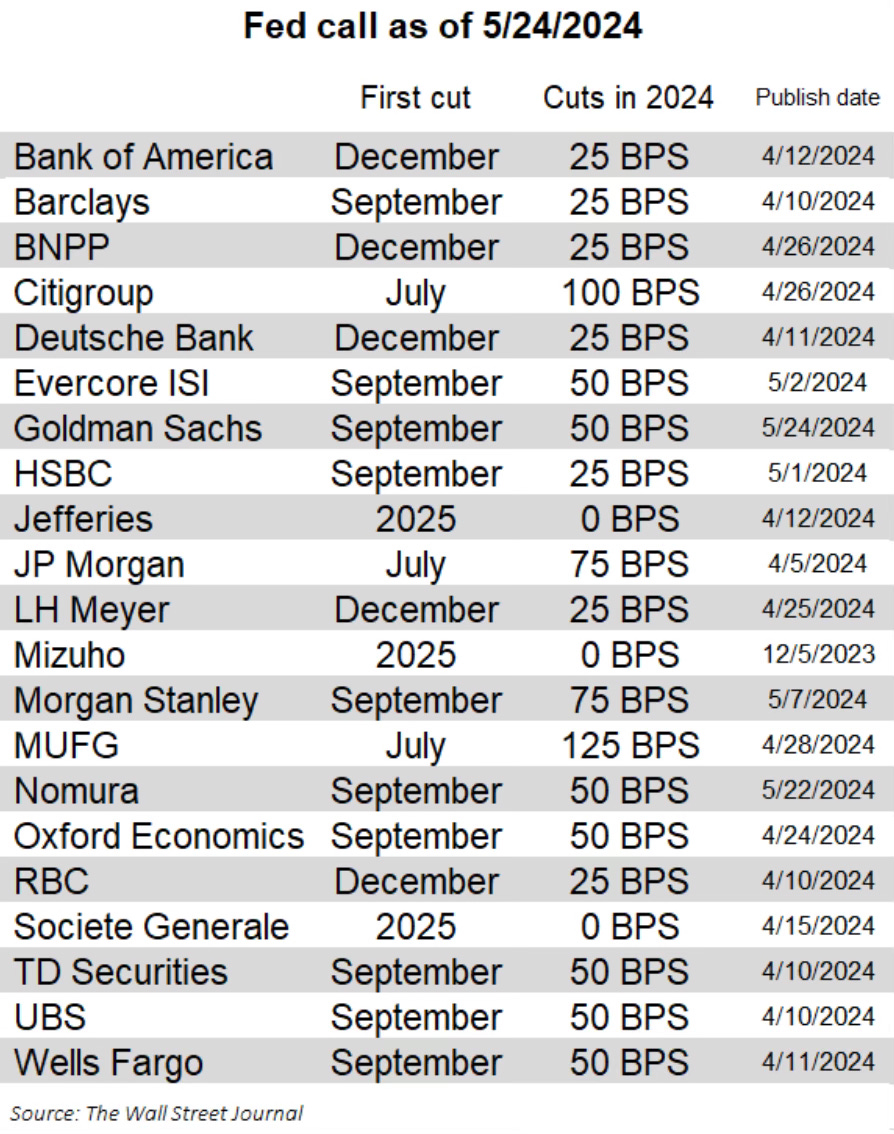
Investing.com's Fed Rate tool, which reflects market expectations for monetary policy adjustments, confirms this. It currently calculates a 47% probability of a rate cut by the September 18th meeting. 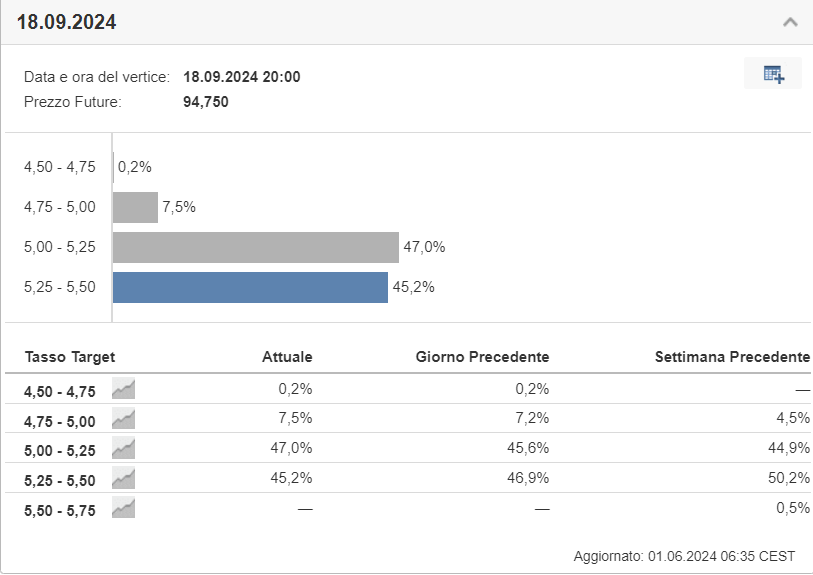
Investors are looking for key signals – could this potential rate cut be the catalyst that could continue to fuel the current bull market?
***
Become a Pro: Sign up now! CLICK HERE to join the PRO Community with a significant discount.

Disclaimer: This article is written for informational purposes only; it does not constitute a solicitation, offer, advice, counsel or recommendation to invest as such it is not intended to incentivize the purchase of assets in any way. I would like to remind you that any type of asset, is evaluated from multiple perspectives and is highly risky and therefore, any investment decision and the associated risk remains with the investor.
Which stock should you buy in your very next trade?
With valuations skyrocketing in 2024, many investors are uneasy putting more money into stocks. Unsure where to invest next? Get access to our proven portfolios and discover high-potential opportunities.
In 2024 alone, ProPicks AI identified 2 stocks that surged over 150%, 4 additional stocks that leaped over 30%, and 3 more that climbed over 25%. That's an impressive track record.
With portfolios tailored for Dow stocks, S&P stocks, Tech stocks, and Mid Cap stocks, you can explore various wealth-building strategies.
